Solana (SOL) has seen a sharp rally, outperforming Ethereum (ETH) significantly over the past week. As SOL’s price against ETH hits multimonth highs, traders are beginning to speculate whether the altcoin could soon break past its previous all-time high and reach the $300 mark.
SOL/ETH Ratio Hits Record Weekly Close
On April 13, the SOL/ETH ratio climbed to 0.080, its highest weekly close on record, according to data from Markets Pro and Binance. This milestone reflects growing investor confidence in Solana, especially in light of a 35% surge in its US dollar value over the past seven days. By contrast, ETH rose by 13% during the same period.
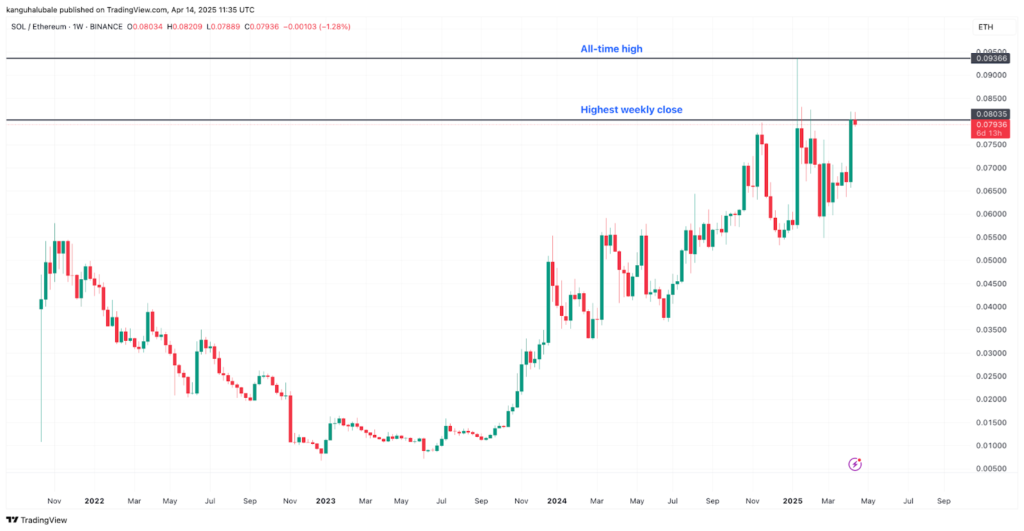
Technical charts also indicate an upward trend, with the SOL/ETH trading pair forming higher highs on the daily chart since April 4. The bullish momentum has prompted traders like pseudonymous analyst Bitcoinsensus to comment that Solana is “flashing a sign of strength” and could continue to outperform Ethereum in the near term.
$300 Target: A Repeat of 2021’s Breakout?
Crypto trader BitBull has highlighted similarities between SOL’s current price movement and ETH’s breakout pattern in 2021. Referring to CME futures data, the trader noted that SOL is currently consolidating between $120 and $130 — a range reminiscent of ETH’s behaviour before it surged to new all-time highs.
“Just like Ethereum’s run in 2021, Solana is setting up for a massive move in 2025,” BitBull shared on social media platform X, suggesting that a breakout to $300 is a realistic scenario if the current structure holds.
Onchain Activity Tells a Different Story
Despite bullish sentiment and technical indicators pointing upwards, some onchain metrics present a more cautious outlook. Solana’s network fees have dropped drastically, falling over 97% to $898,235 on April 14, down from $35.5 million on January 20. This decline is attributed to reduced activity on key platforms such as Raydium, Pump.fun, and Orca.

Furthermore, daily decentralised exchange (DEX) volumes on the Solana network have plummeted to $2.17 billion — a sharp 93% fall from the peak of $35.9 billion seen in January. Fees on several decentralised applications including Jito, Moonshot.money, Meteora, and Photon have also remained stagnant since mid-February.
Climbing to $300: Ambition vs Reality
Solana is currently trading at $133, reflecting a 3% increase over the past 24 hours. However, it remains nearly 55% below its all-time high of $295, recorded on January 19.
While chart patterns and trader optimism point to a potential breakout, Solana’s path to $300 remains uncertain unless there is a substantial resurgence in network activity and user engagement across its decentralised applications. Without this, the bullish momentum may not be enough to drive SOL to new record highs in the short term.