
XRP has reclaimed its position as a bullish contender in the cryptocurrency market, reaching its highest value in six years. On January 15, the cryptocurrency hit $2.89, rebounding by over 30% from its monthly low and erasing the losses incurred earlier in 2025.
Whale Accumulation and ETF Speculation
The price surge aligns with significant whale activity, as wallets holding between 1 million and 10 million XRP tokens have accumulated the cryptocurrency at a rapid pace. This bullish sentiment has been further fuelled by a prediction from a JPMorgan analyst, suggesting that US XRP ETFs, if approved, could draw in $4 billion to $8 billion in net new assets.
Adding to the optimism, the upcoming inauguration of President-elect Donald Trump on January 20 could act as a pivotal moment for XRP, potentially paving the way for regulatory approval of spot XRP ETFs in the US.
Bull Flag Setup Suggests $4 Target
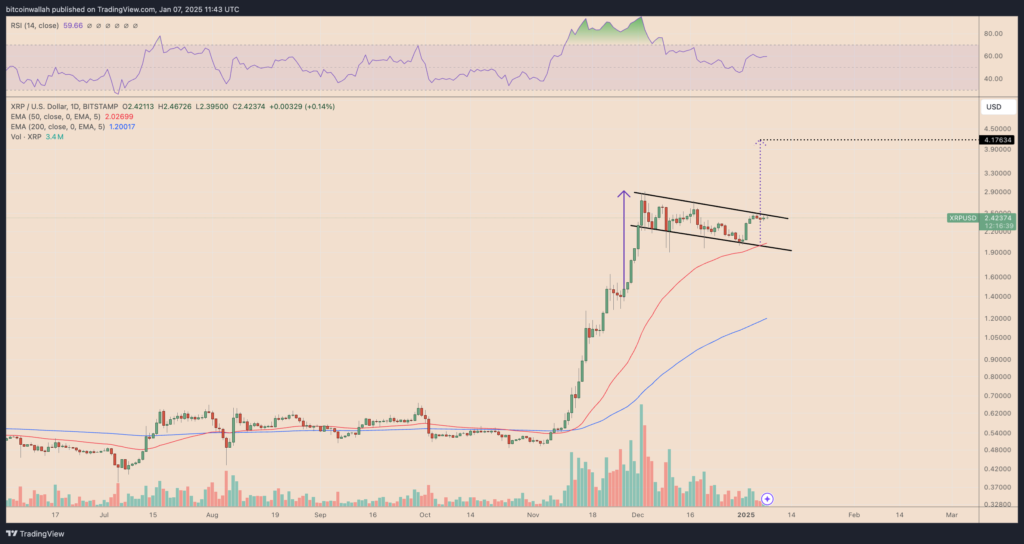
XRP’s daily chart highlights a bullish flag pattern following its 105% rally in November and December 2024. This pattern is defined by a downward-sloping consolidation channel, now resolved with a breakout above $2.72.
Technical analysis points to a potential rally of 50% from current levels, aiming for a price target of $4.16 by February. Supporting this outlook, XRP’s Relative Strength Index (RSI) at 66 indicates room for upward momentum. Additionally, the price remains above its 50-day Exponential Moving Average (EMA) at $2.15, which acts as a strong support level.
Weekly Chart Predicts $13 Milestone
On the weekly timeframe, XRP has broken out of a bull pennant pattern, a structure formed during consolidation after a strong upward move. According to technical rules, this breakout could lead to a price surge equivalent to the height of the previous rally, suggesting a target of $13 in the coming months.
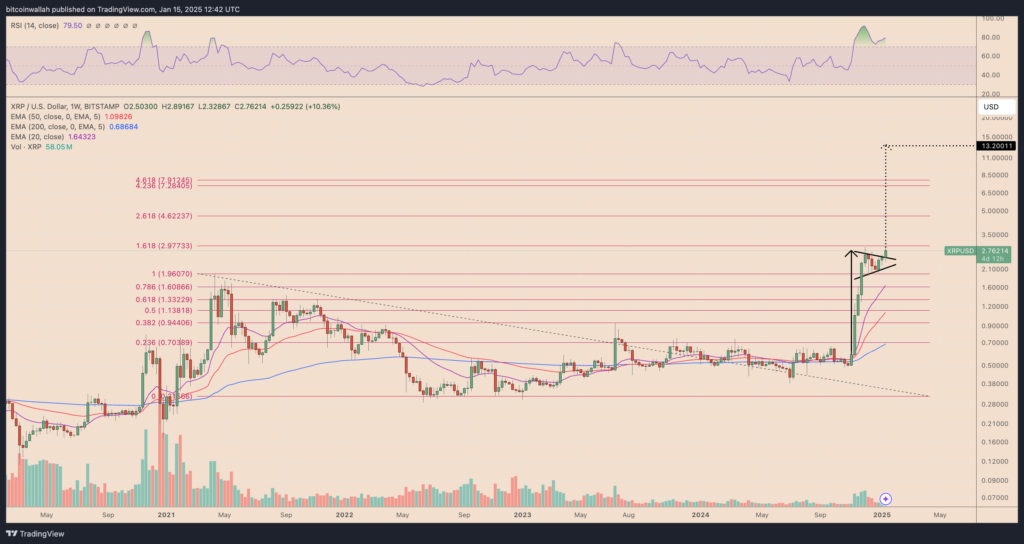
The cryptocurrency is trading well above its key moving averages, including the 50-week EMA at $1.64 and the 200-week EMA at $0.69, indicating robust market support. Fibonacci extension levels further reinforce intermediate resistance at $3 and $4.62, with a long-term breakout target near $13.
Analyst Predicts $18 Based on 2017 Fractal
Prominent analyst Dark Defender has drawn parallels between XRP’s current price action and its 2017 bull market performance. During that rally, XRP posted gains exceeding 1,000%. Based on similar Fibonacci retracement levels, the analyst forecasts potential upside targets of $10.22 and $18.22 in the near term.
Overbought Conditions and Short-Term Risks
Despite the bullish outlook, XRP’s RSI on the weekly chart has climbed to 79.5, indicating an overbought condition. This could lead to short-term price corrections or consolidations before further upward movement.

As XRP continues to gain momentum, it remains poised to test critical resistance levels. Whether it can sustain this trajectory and reach double-digit prices will depend on market dynamics and regulatory developments in the coming months.