Solana Faces Further Losses as Investor Interest Diminishes
Solana (SOL) has experienced a sharp decline, dropping by 6.5% in the past 24 hours to trade at around $127 on 17 March. The broader cryptocurrency market has also faced similar losses. Key factors driving this downturn include decreasing investor interest in Solana’s decentralized finance (DeFi) ecosystem, declining open interest, negative funding rates, and bearish technical indicators suggesting further downside potential.
Solana’s DeFi Ecosystem Sees Sharp Decline
A significant factor behind SOL’s recent slump is the diminishing total value locked (TVL) in its DeFi applications. According to data from DefiLlama, Solana’s TVL has been in a downward trend since mid-January, falling from a peak of $12.1 billion on 19 January to $6.63 billion by 11 March. As of 17 March, TVL has recovered slightly to $7 billion but remains 41% below its January high.
This decline mirrors SOL’s price movement, which has dropped by 56% over the same period. Several layer-2 protocols within Solana’s ecosystem, such as Jito and Raydium, have seen TVL declines of 30% and 32%, respectively, in the past month. The shrinking TVL indicates reduced trader interest, suggesting Solana is struggling to attract new users despite its relatively low transaction costs.
Falling On-Chain Activity Signals Weakening Demand
Data from Dune Analytics highlights a drop in on-chain activity within Solana’s network. A significant decline in network transactions preceded SOL’s latest price drop, with daily transactions falling from a record high of 71,738 on 23 January to just 24,505 by 17 March.
This reduced activity translates to lower revenue from transaction fees, negatively impacting SOL’s valuation. The declining network engagement signals weakening demand, further contributing to the ongoing price correction.
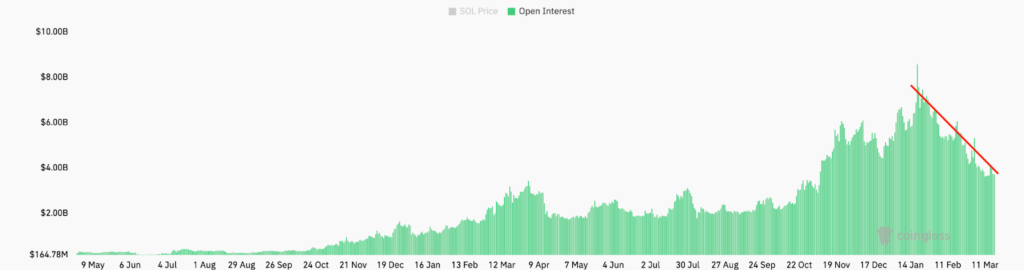
Solana Open Interest Declines Amid Negative Funding Rates
Solana’s open interest (OI) in the futures market has been falling, reflecting a lack of speculative demand. OI has dropped from its local peak of $8.57 billion on 17 January to $4.03 billion as of 17 March. A declining OI suggests traders are closing their positions, reducing upward price momentum.
Additionally, SOL’s weekly funding rates have remained negative at -0.10% since 17 March, four months after peaking at 1.37%. Negative funding rates indicate that short sellers are paying long traders to maintain their positions, further demonstrating market scepticism regarding SOL’s short-term prospects.
Technical Indicators Suggest Further Downside Risk
Solana is currently trading 56% below its all-time high of approximately $294, recorded on 19 January. Technical analysis suggests further downside risks, with key support and resistance levels to monitor in the coming weeks.
SOL has struggled to break above the $135 resistance level, with bulls failing to sustain upward momentum. If the price falls below the critical $120 support level, the SOL/USDT pair could drop to $110, a level last seen on 5 August 2025. A break below this range could trigger a further decline to $100 and eventually to $80, representing a potential 35% price decrease from current levels.
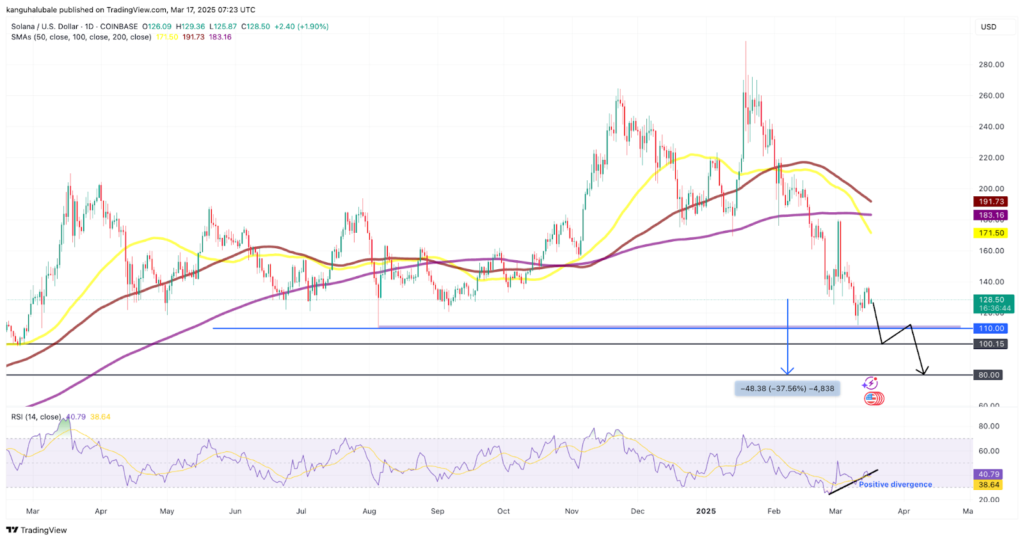
However, there are signs that bulls are accumulating SOL at lower levels, as indicated by a positive divergence in the Relative Strength Index (RSI). If SOL can break and close above the $140 psychological barrier, it may signal a reduction in selling pressure, potentially leading to a recovery rally toward the 50-day simple moving average (SMA) at $171. Bears are expected to mount strong resistance at this level.
Conclusion
Solana’s price decline is driven by weakening investor interest in its DeFi ecosystem, reduced on-chain activity, and negative sentiment in the futures market. With technical indicators suggesting further downside, traders should monitor key support and resistance levels. While bearish momentum currently dominates, a break above $140 could indicate a potential recovery in the near term.