LTC Rallies on Canary Capital’s Spot ETF Filing
Litecoin (LTC) experienced a remarkable surge of around 20% in the past 24 hours, reaching approximately $120.50 on 16 January. This rally follows the filing of an amended S-1 form by Canary Capital for its proposed spot Litecoin exchange-traded fund (ETF).
The updated filing has sparked optimism among traders, positioning Litecoin as a potential frontrunner for regulatory approval of a crypto ETF in the United States. Analysts at Bloomberg have noted the significance of the 15 January filing, suggesting that the U.S. Securities and Exchange Commission (SEC) is actively considering Litecoin-focused ETF applications.
“This development supports our view that Litecoin is the most likely candidate for the next crypto ETF approval,” said Bloomberg ETF analyst Eric Balchunas. However, Balchunas also warned that a leadership change at the SEC could influence the decision-making timeline.
The broader crypto market has seen sharp rallies in recent weeks, with assets such as XRP, Solana, and Cardano benefitting from similar ETF-driven speculation. Litecoin’s latest price movement reflects growing expectations of institutional adoption through ETF approvals.
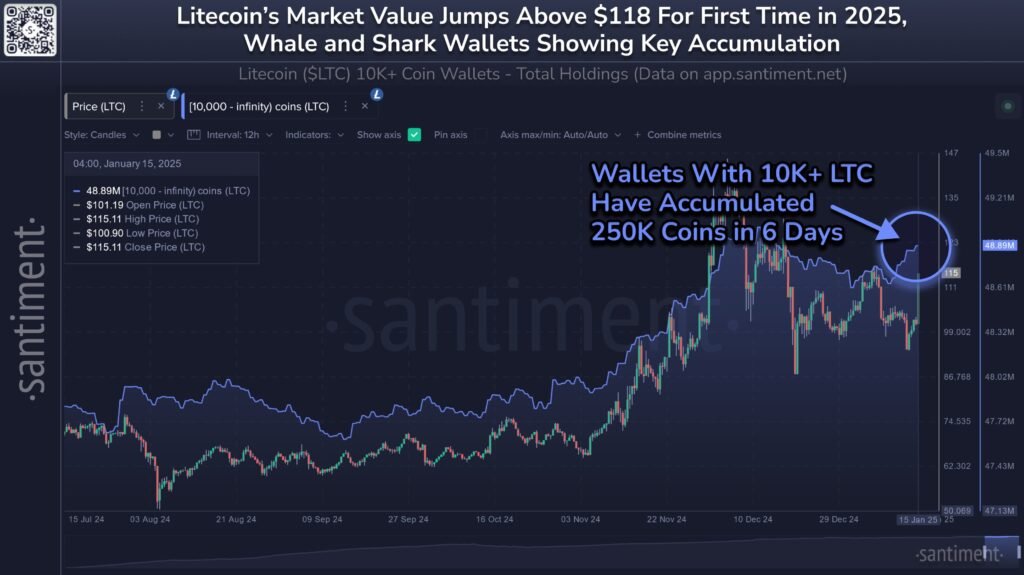
Whales and Sharks Drive Demand for Litecoin
On-chain data indicates a surge in accumulation by high-volume Litecoin investors. According to analytics firm Santiment, wallets holding at least 10,000 LTC have collectively added 250,000 LTC to their holdings over the past week. This buying activity began on 9 January and has coincided with Litecoin’s 25% price increase during the same period.
The accumulation by so-called “whales and sharks” suggests growing confidence in Litecoin’s prospects, fuelled by the potential regulatory approval of the Canary Litecoin ETF.
Technical Indicators Point to Further Gains
Litecoin’s breakout from a descending triangle pattern has further strengthened bullish sentiment. While descending triangles are often viewed as bearish reversal indicators, they can also signal bullish continuation trends when prices break above the upper trendline, as seen with Litecoin on 15 January.
The cryptocurrency’s breakout, accompanied by rising trading volumes, suggests that LTC could now target $157 by February—a potential 32% gain from current levels. This target corresponds to the maximum height of the descending triangle pattern.
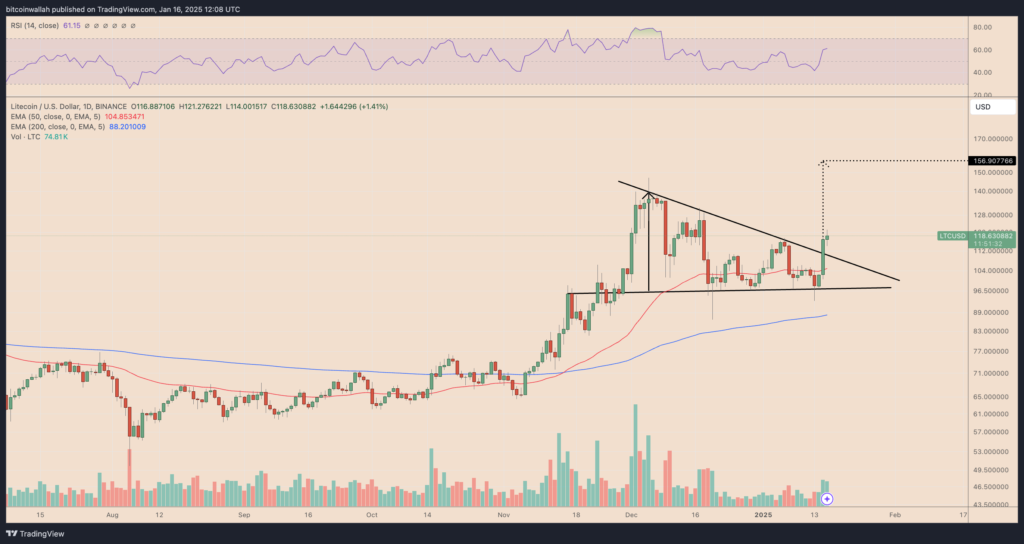
However, analysts caution that a pullback below the broken trendline would invalidate this bullish outlook. Immediate support for Litecoin lies near the 50-day exponential moving average (EMA) at around $105.
Outlook for Litecoin
The growing anticipation surrounding a potential Litecoin ETF has spurred both institutional and retail interest in the asset. With the recent accumulation by major investors and bullish technical signals, Litecoin appears poised for further gains.
Nonetheless, regulatory uncertainties remain a critical factor. As the SEC reviews the Canary Litecoin ETF application, market participants will be watching closely for any developments that could influence Litecoin’s trajectory in the coming weeks.