Bitcoin’s price continues its upward push, nearing fresh April highs, but mixed sentiment among traders suggests uncertainty about the longevity of the rally.
Bitcoin Eyes $87K Amid Resistance
Bitcoin (BTC) hovered around $84,775 on April 15 as it attempted to break through the $86,000 mark during the Wall Street open. After a strong weekend performance, traders had hoped for a continued move toward the $90,000 range — a level not seen since early March. However, resistance levels and ongoing macroeconomic uncertainty, especially surrounding the US trade tensions, have left many cautious.
While momentum appeared bullish in the short term, several analysts urged restraint. Trading group Stockmoney Lizards commented on the rapidly shifting sentiment among traders: “Just days ago, everyone predicted $50K, and now they’re flipping bullish at the first green candle. This emotional rollercoaster is why most traders lose money.” The group noted that although the market is gaining strength, Bitcoin still faces several resistance hurdles before any correction can be declared over.
Rangebound Action Likely to Continue
Stockmoney Lizards forecasted a period of consolidation, suggesting BTC may continue to range between $78,000 and $88,000 in the coming weeks. “My outlook remains cautiously optimistic,” the group noted. They further predicted that if Bitcoin clears the critical $97,000 level, a push toward $110,000 or more could materialise by late summer.
Breaking the Trendline: A Mixed Signal?
A key focus among market watchers has been Bitcoin’s attempt to break above a multi-month downward trendline that has held since its January all-time high. Some traders see this development as an encouraging sign of a potential reversal.
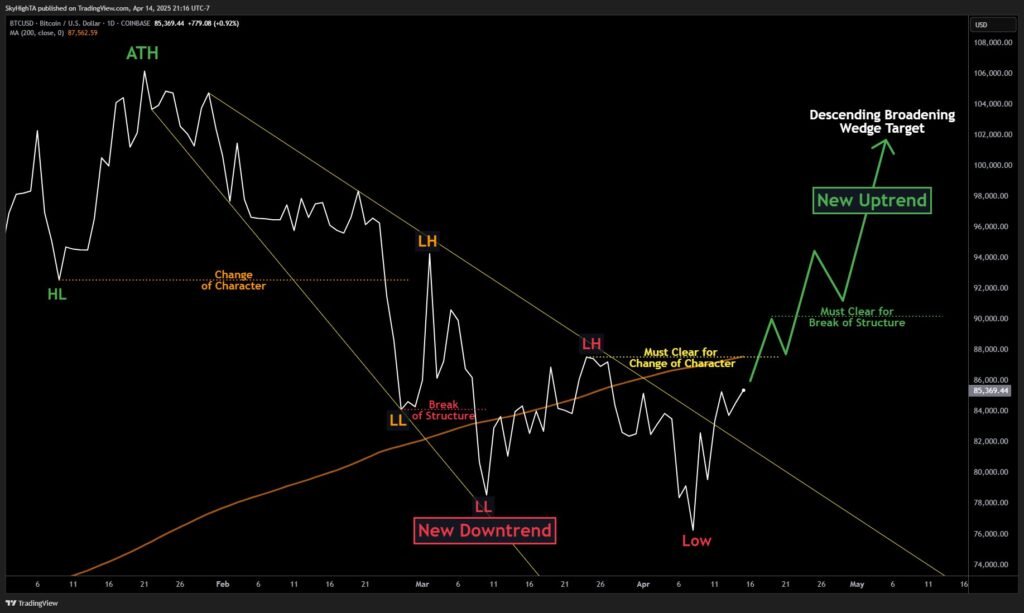
“Bitcoin didn’t just break the downtrend for $86K — it wants to challenge for a higher high near the 200-day moving average,” said trader SuperBro, referencing the 200-day simple moving average (SMA) currently sitting at $87,566. SuperBro believes that a successful higher high could lead to a healthy retracement before Bitcoin continues its climb toward a wedge target above $100K.
Scepticism from Veteran Traders
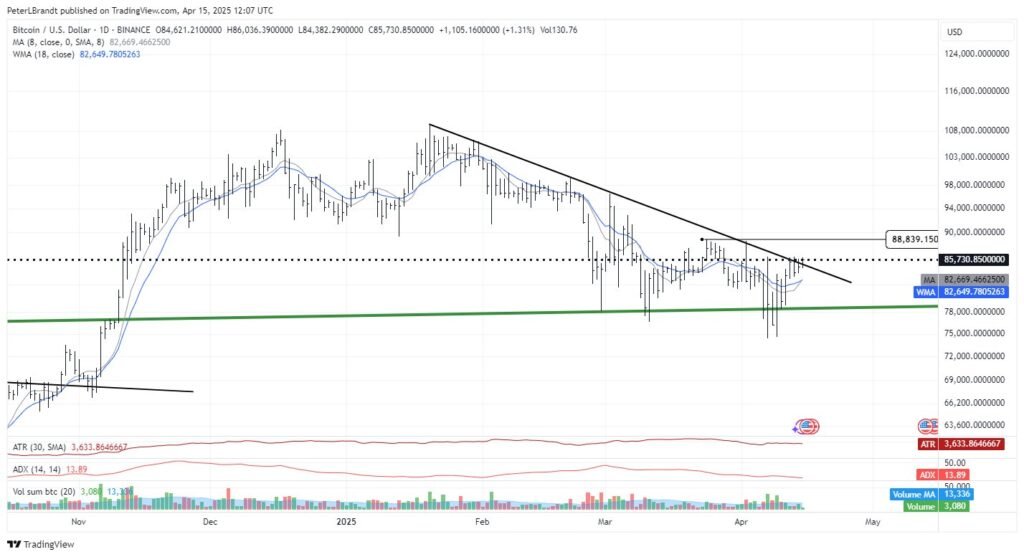
Not all analysts are convinced. Renowned trader Peter Brandt expressed scepticism over the significance of trendline breaks, stating, “Of all chart construction, trendlines are the least significant. A trendline violation does NOT signify a transition of trend.” Brandt’s comments highlight a broader divide in the market between technical optimists and those urging caution.
As Bitcoin flirts with critical resistance levels, the coming days may determine whether this surge represents the start of a fresh rally or simply another phase in a larger consolidation.