


Bitcoin is showing signs of renewed strength as it trades close to two month highs, with several widely followed technical indicators flashing signals that have historically appeared near major market bottoms. As BTC pushes toward the $101,000 level, traders are watching closely to see whether this move can confirm a broader trend shift after months of uncertainty.
Momentum builds as Bitcoin hits two month highs
Bitcoin price action has improved steadily over recent sessions, with BTC climbing toward the $98,000 zone and briefly testing levels not seen since early autumn. Market participants note that the current environment looks healthier than at any point since the start of October, both in terms of price structure and momentum indicators.
Unlike previous relief rallies, this move has been supported by improving leading indicators rather than short term speculation alone. Volume has stabilized, volatility has cooled, and price has held higher lows on multiple timeframes. For many traders, this combination suggests that the market may be transitioning away from defensive positioning.
RSI divergence hints at a potential trend reversal
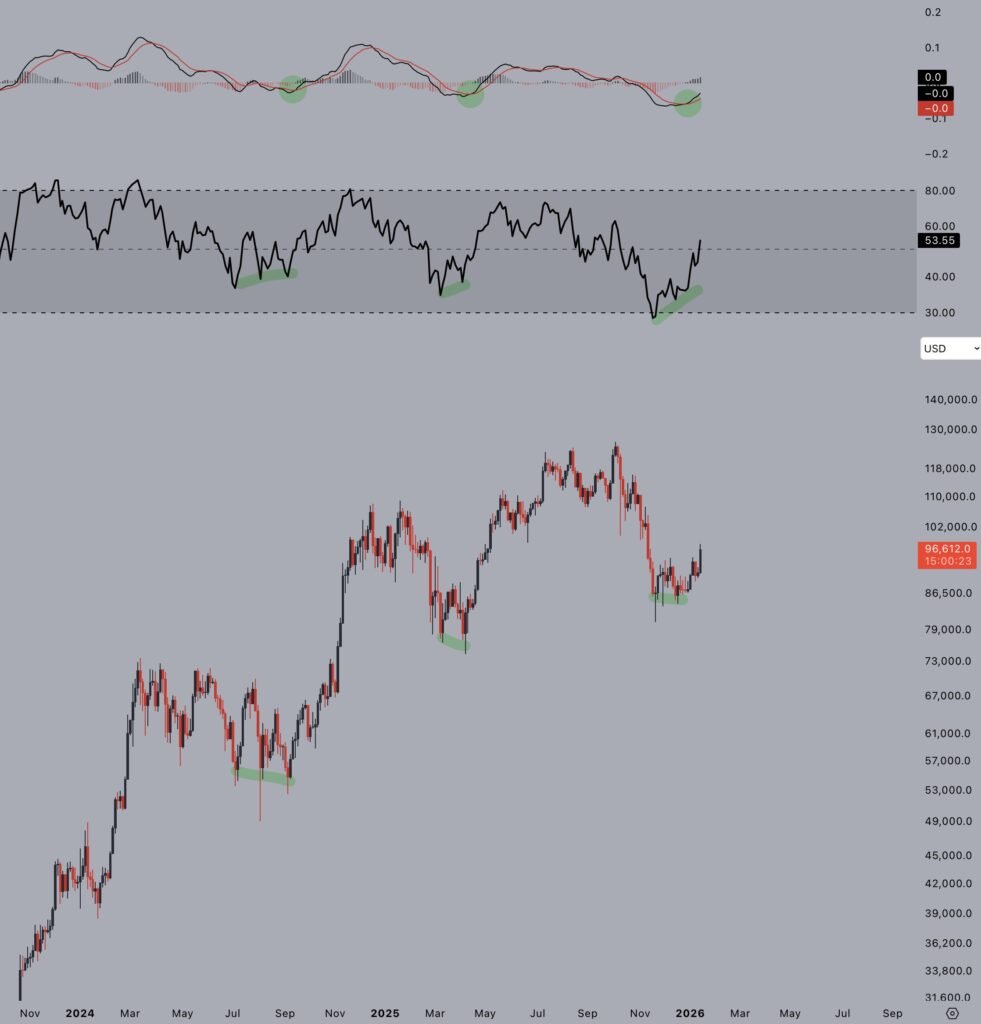
One of the clearest technical signals supporting the bullish narrative is the behavior of the relative strength index. On lower timeframes, Bitcoin RSI has been printing a hidden bullish divergence, a setup where the indicator forms lower lows while price continues to make higher lows. This pattern often appears during trend continuation phases and can signal underlying strength that is not yet obvious on the chart.
A similar structure was observed last week on the four hour chart when BTC tested the $90,000 support area. At the time, some analysts projected a move toward $105,000, a level that now looks ambitious in the short term. Still, the RSI itself remains constructive and far from signaling exhaustion.
Notably, RSI has moved back above the 50 midpoint on higher timeframes for the first time since early October. Many traders view this level as a dividing line between bullish and bearish conditions. Its reclaim suggests that momentum may be shifting back in favor of buyers.
MACD buy signal adds weight to bullish outlook
The moving average convergence divergence indicator is also contributing to the growing optimism. On three day timeframes, MACD has produced a bullish cross, aligning with the RSI divergence. This pairing is relatively rare and has previously coincided with significant market bottoms.
Trader Jelle highlighted this combination in a recent social media post, pointing out that past instances of a bullish MACD cross alongside RSI divergence marked the end of corrective phases. According to his analysis, the current setup mirrors those earlier turning points, making it difficult to ignore despite lingering macro uncertainty.
Together, RSI and MACD are painting a picture that looks very different from conditions that dominated through much of October and November, when rallies repeatedly failed and momentum indicators struggled to recover.
Eyes on the $101,000 level and the 50 week average
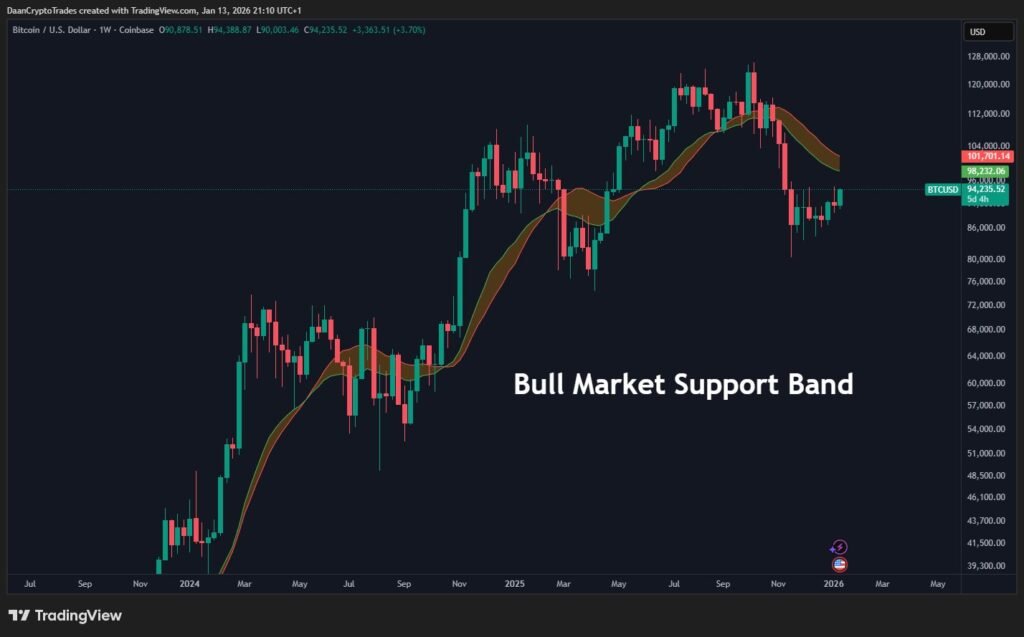
While short term indicators are improving, a larger technical test looms. Bitcoin is approaching its 50 week simple moving average, which currently sits near $101,000. This level has taken on added significance because BTC has never reclaimed the 50 week average during a bear market year.
Commentator Isiah described the upcoming test as a potentially historic moment. If Bitcoin manages to move above the 50 week SMA and hold it as support, it would challenge long held assumptions about how BTC behaves during broader market downturns. Failure, on the other hand, could reinforce the idea that the current rally is still part of a larger corrective structure.
Bitcoin first lost the 50 week average at the start of November, and since then it has acted as a ceiling on price. Just above it sits the bull market support band, formed by two additional moving averages that often define the boundary between bullish and bearish regimes.
Bull market support band retest could be decisive
Several traders believe a retest of the bull market support band is likely in the near term. Daan Crypto Trades noted that this band is moving lower at a relatively fast pace while price is grinding higher, increasing the probability of a test.
Historically, Bitcoin tends to revisit this zone after sharp moves, regardless of whether the outcome is a breakout or a rejection. The reaction there often sets the tone for weeks or even months. A clean break above would strengthen the case for a sustained uptrend, while rejection could signal that consolidation or another pullback lies ahead.
For now, Bitcoin remains in a critical window. Momentum indicators suggest strength, price structure looks improved, and sentiment is slowly recovering. Whether this translates into a confirmed trend reversal will likely depend on how BTC behaves around the $101,000 level and the key moving averages overhead.
As 2026 approaches, some analysts are already questioning whether it could become a bear market year unlike any other. Bitcoin reclaiming levels that were previously untouchable during downturns would certainly support that argument. Until then, traders remain cautious but attentive, watching closely as classic bottom signals continue to build.