
Bitcoin defies bearish patterns as traders predict new all-time highs.
Bitcoin (BTC) continued to trade above $100,000 on 7 January, posting daily gains of 4% amidst renewed optimism in the market. With bullish patterns returning to the radar, traders and analysts are now predicting where BTC’s price could head next.
Head and Shoulders Reversal Under Threat
Bitcoin’s sustained move above six figures is challenging previously bearish chart patterns. Among them is the “head and shoulders” formation, which typically signals a trend reversal.
This pattern features three peaks, with the middle “head” higher than the two “shoulders.” For Bitcoin, the $108,000 all-time high forms the head. However, analysts believe this reversal pattern may fail.

Aksel Kibar, a trader and market analyst, noted that BTC is now testing the high of the potential right shoulder. In a post on social media platform X, he explained, “Breach can result in a pattern negation and should be considered bullish. H&S failure price target stands at $116K.”
Even if the pattern plays out, Kibar suggests the price could dip to $80,000 or even retest the previous all-time high of $73,800, without cancelling the overall bullish trend.
Cup and Handle Formation Signals $140K
The “cup and handle” pattern—a classic bullish indicator—remains in play for Bitcoin. After reaching March’s highs and retracing to near $90,000 multiple times, fears of a breakdown had emerged. However, recent price action is rekindling optimism.
“Bitcoin looks ripe to complete the cup & handle formation,” trader Jelle told followers on X, predicting a target of $140,000. Kibar echoed this sentiment, with his monthly chart indicating a possible target of $137,000 if the formation succeeds.

The cup and handle setup has been under scrutiny for months, with commentators like MartyParty reaffirming a target of $125,000 in late December when BTC traded at $94,000.
Fibonacci Levels Guide Market Expectations
Zooming out, Fibonacci retracement levels are offering insights into Bitcoin’s long-term potential. Keith Alan, co-founder of Material Indicators, highlighted that recent surges have been capped by the 1.618 Fibonacci level, a common point of resistance.
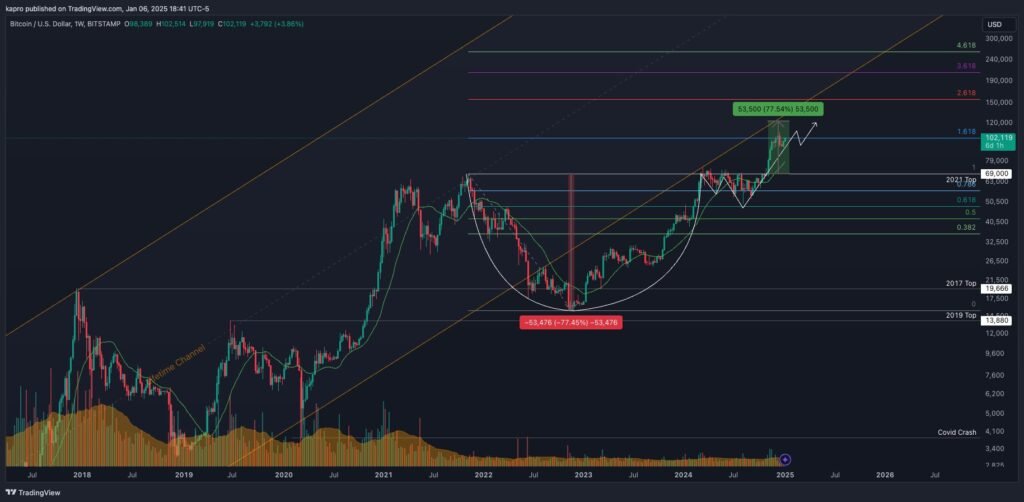
“Once Bitcoin bulls push past this and return to price discovery making new all-time highs, the next levels of resistance are also quite predictable,” Alan noted.
Targets of $110,000 and $122,500 align with the cup and handle formation. Beyond that, Bitcoin’s potential cycle top could range between $120,000 and technical resistance levels at the 2.618, 3.618, or even 4.618 Fibonacci extensions, depending on the timing.
Bitcoin Eyes New Highs
Bitcoin’s ability to hold above $100,000 is reigniting bullish momentum, with traders targeting a potential top between $120,000 and $140,000 in the current cycle. While bearish patterns like the head and shoulders formation loom in the background, confidence in the cup and handle breakout is growing.
With Fibonacci levels offering further clarity on resistance zones, the market remains focused on whether Bitcoin can continue its rally into uncharted territory. For now, six figures are holding strong, and traders are preparing for the next leg up.