


Zcash (ZEC), the privacy-focused cryptocurrency, has stunned the market with an extraordinary surge over the past month, climbing 1,200% to hit a 2,800-day high above $520. The move comes after years of sideways action, marking ZEC’s highest level since 2018.
The price explosion followed a decisive breakout from a long-standing symmetrical triangle pattern in September, triggering a parabolic rise that has captured traders’ attention. Despite brief pauses along the way, ZEC’s momentum has remained remarkably strong, making it one of the few digital assets to post such exceptional gains in an otherwise mixed crypto market.
This resurgence has raised eyebrows among both traders and analysts, many of whom now believe Zcash could be nearing the end of its meteoric run.
Technical Setup: A Textbook Wave Pattern in Motion
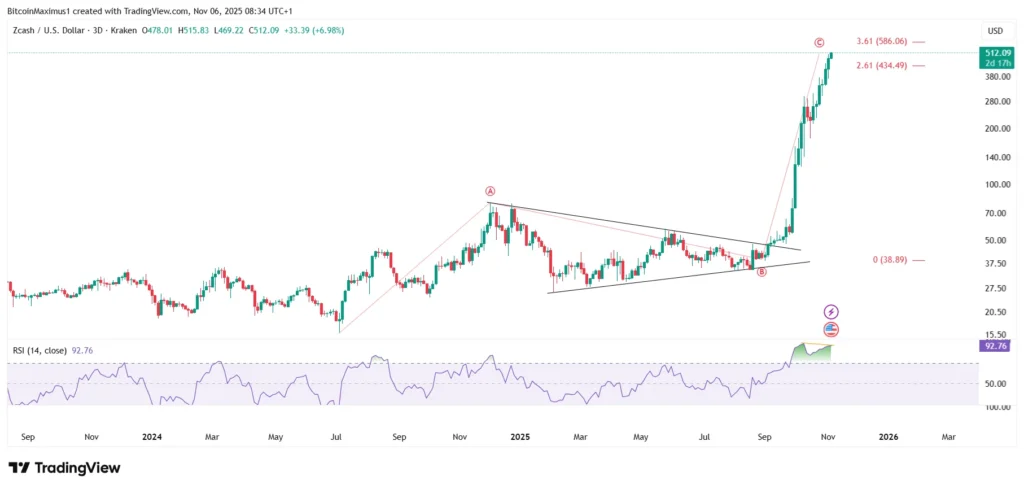
Zcash’s recent rally appears to align neatly with Elliott Wave Theory, a framework used by technical analysts to predict market cycles. According to current chart structures, ZEC is believed to be completing wave C of an ongoing A-B-C corrective formation.
Wave C, which typically represents the final phase of a corrective upswing, has already stretched nearly 3.61 times the length of wave A, signalling an overextended move. Historically, such extensions often precede exhaustion phases, suggesting that the current momentum could soon fade.
Adding to this cautionary outlook, the Relative Strength Index (RSI) has started to flash warning signals. The emergence of bearish divergence, where price continues to climb while RSI weakens, implies a loss of underlying momentum. This pattern frequently indicates that buying pressure is diminishing, paving the way for a possible reversal.
Short-Term Charts Echo Warning Signs
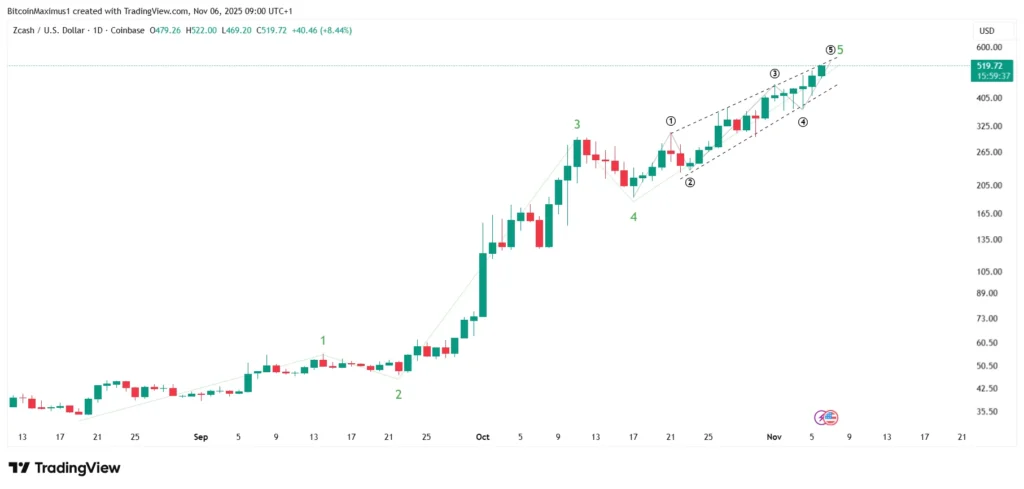
Zooming into the six-hour timeframe, ZEC appears to be moving within a narrowing ascending wedge, a classic pattern that often precedes bearish reversals. Since October 23, the coin has completed a five-wave upward sequence, consistent with the final leg of an extended rally.
From a wave perspective, this movement likely represents wave five within the broader wave C, another technical sign that the uptrend could soon run its course. Together, these signals form a rare convergence between short-term and long-term technical indicators, both pointing toward a nearing top.
While minor upward extensions are still possible, analysts believe the window for further gains is shrinking rapidly. The next major resistance sits around $586, and any approach toward that level could mark the final push before a corrective phase begins.
What Comes Next for Zcash?
Despite its breathtaking ascent, Zcash now faces mounting pressure to sustain its gains. Parabolic rallies, such as the one ZEC has just witnessed, are often unsustainable, typically followed by sharp retracements as traders lock in profits and late buyers exit positions.
If the predicted top holds true, a significant correction could unfold in the coming weeks, potentially dragging ZEC back toward earlier support zones near $300 or even lower.
However, long-term investors may still find reason for optimism. The renewed market interest, technical breakout, and heightened liquidity could provide a foundation for a more stable price structure after the inevitable cooling-off phase.
Conclusion: Caution Amid Euphoria
Zcash’s 1,200% surge has reignited excitement around one of the market’s most privacy-centric cryptocurrencies. Yet, as technical indicators grow increasingly bearish, the data suggest that this rally may be approaching its climax.
While ZEC could see a final spike toward $586, traders should brace for potential volatility and possibly a steep correction once the momentum fades. For now, Zcash stands at a crossroads: either extend its breakout into a new bullish phase or face the realities of a long-overdue pullback.


