XRP’s ongoing battle to break past the $3.00 mark continues to face headwinds, with onchain metrics and market data pointing toward weakening momentum. Despite trading in a tight range for the past month, declining network activity, falling open interest, and persistent resistance at key technical levels suggest further downside for the altcoin.
Network Activity Declines Sharply
The XRP Ledger has seen a significant drop in network activity over the past six months. According to data from Glassnode, new daily addresses on the network have declined steeply, falling from a peak of 15,823 on 16 January 2025 to just 3,500 as of Thursday.
Similarly, daily active addresses (DAAs) have witnessed a sharp contraction. From a three-month high of 577,000 recorded last Saturday, DAAs plunged to just 34,360 on Thursday. This substantial drop suggests weakening investor interest and reduced confidence in XRP’s near-term prospects.
Historically, such declines in network activity have often preceded price stagnation or further downward movements. Lower transaction volumes typically indicate reduced liquidity and buying momentum, limiting the altcoin’s capacity for bullish breakouts.
Open Interest Drop Reinforces Bearish Sentiment
Further compounding XRP’s troubles is the falling open interest (OI) in the derivatives market. Data from CoinGlass shows a 30% decline in OI over the past month, from $5.53 billion to $3.89 billion. This drop indicates that investors are increasingly closing their positions, potentially anticipating further price weakness.
A similar pattern was observed earlier this year, when a sharp decrease in OI led to a significant price drop. In January, XRP fell by 53%, from a multi-year high of $3.40 to a multi-month low of $1.61 by early April. The current trajectory appears to be following the same bearish script.
Technical Resistance Caps Price Growth
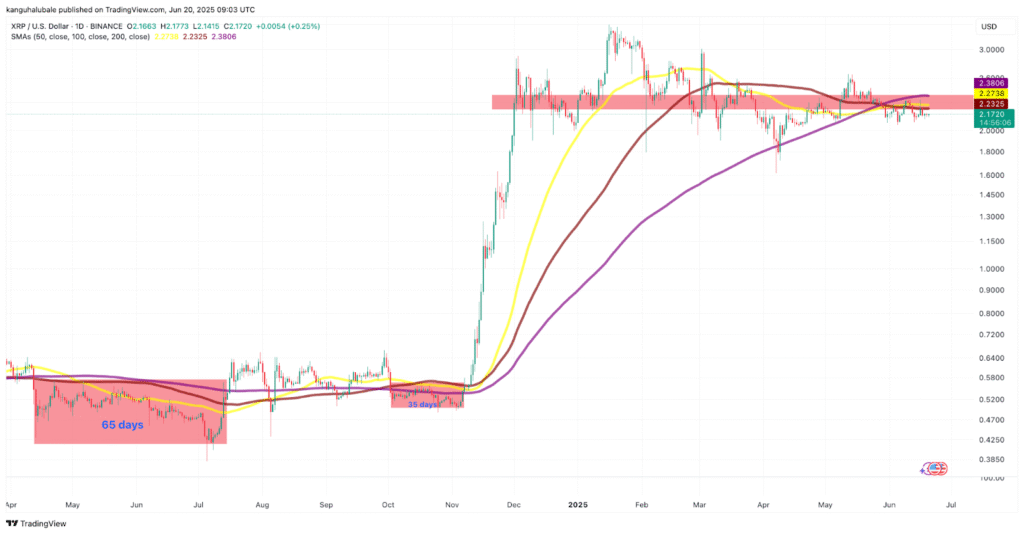
XRP’s price action over the past 30 days has been confined within a narrow range of $2.05 to $2.33, failing to gain the strength required to challenge the $3.00 level. Technical indicators show that XRP remains stuck beneath major simple moving averages (SMAs), which are currently positioned within a key resistance zone between $2.22 and $2.40.
If bulls fail to push the price above these trendlines, XRP may continue to consolidate for several more weeks. Historical data reveals that during previous instances when XRP remained below these moving averages, the token traded sideways for extended periods, 30 and 65 days, respectively, before experiencing sharp declines.
XRP analyst and trader CasiTrades highlighted the importance of the $2.25 resistance level in a recent post on X (formerly Twitter), noting:
“As long as this remains resistance, it increases the likelihood that we’ll sweep the lower levels: $2.01, $1.90, even $1.55 are still on the table.”
Descending Triangle and RSI Add to Bearish Case
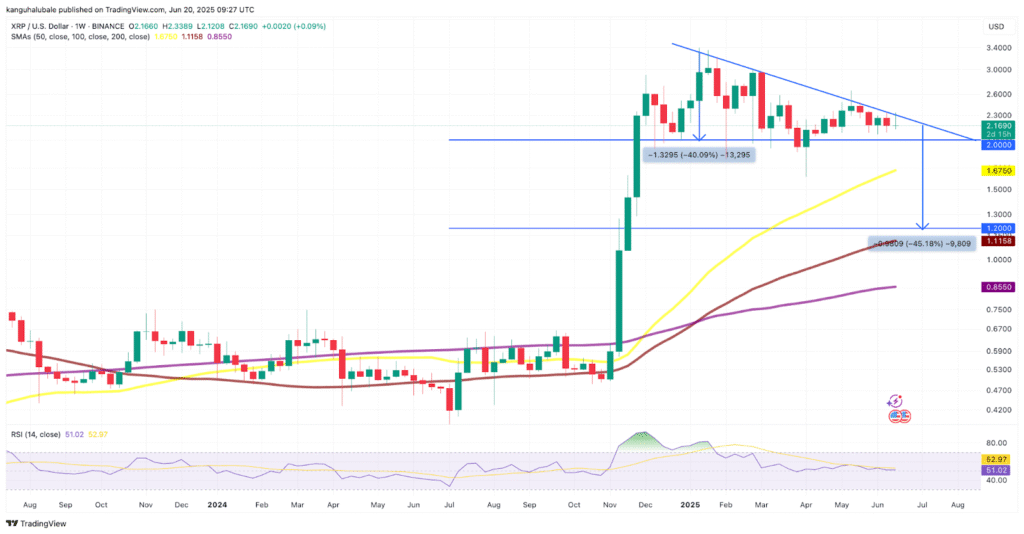
A descending triangle formation is currently playing out on XRP’s price chart, with analysts warning of a potential 45% decline if the $2.00 support level is broken. This pattern suggests that a drop toward $1.20 could be on the horizon if bearish pressure persists.
Meanwhile, the relative strength index (RSI), a momentum indicator, has fallen to 51 after reaching an overbought level of 81 in January. This shift indicates growing bearish momentum and a weakening price trend.
Could Long-Term Consolidation Lead to Breakout?
Despite the prevailing negative signals, some market participants remain hopeful. XRP has been consolidating below the $3.00 level for over 200 days, and historical precedent offers a sliver of optimism. In 2017, a similar prolonged consolidation phase eventually led to a powerful breakout, propelling the token to new highs.
However, until network activity recovers and technical resistance levels are overcome, XRP’s path toward $3.00 and beyond remains clouded by uncertainty. For now, the altcoin appears locked in a struggle between bullish aspirations and bearish market realities.