XRP, the native token of Ripple, is showing signs of potential downside movement as key technical indicators and derivatives data paint a bearish picture. After dropping by 12.6% in just five days, XRP was trading around $1.91 on June 22, down from its recent peak of $2.26. With a descending triangle pattern forming on the charts and derivatives market sentiment turning negative, XRP may face a sharp correction unless key support levels hold.
XRP Derivatives Signal Weak Market Confidence
Recent data from CoinGlass shows a sharp 36% decline in open interest (OI) for XRP futures, falling from $5.53 billion on May 14 to $3.54 billion by June 23. This suggests that traders are exiting their positions, likely anticipating further price drops. Historically, declining OI is seen as a sign of weakening momentum, as it reflects reduced capital inflow and waning investor enthusiasm.
The situation mirrors a previous phase between January 20 and February 8, when OI dropped 74%, leading to a 32% fall in XRP’s price from a high of $3.40 to $2.26. Adding to the bearish sentiment, funding rates for XRP flipped negative on June 23, moving from 0.0057% to -0.0068%, suggesting more traders are betting on the price to fall further.
Descending Triangle Hints at Sharp Decline to $1.18
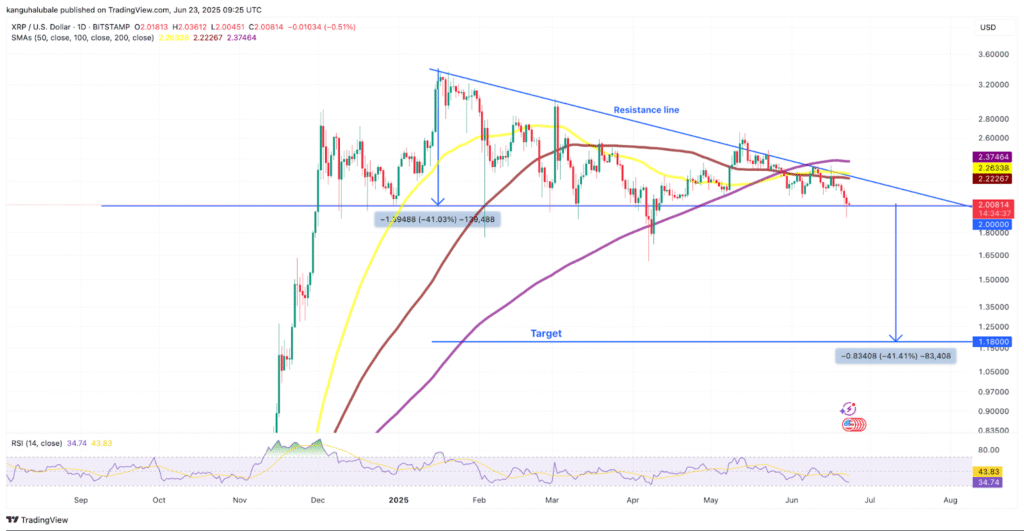
On the daily chart, XRP has been forming a descending triangle pattern since its late-2024 rally. This pattern typically signals a bearish reversal when it follows an uptrend. It is marked by a flat support line, currently at $2.00, and a downward-sloping resistance line.
If the price decisively breaks below the $2.00 support, it could trigger a drop toward $1.18, the projected downside target based on the triangle’s height. This would mark a 41% decline from current levels. XRP bulls are struggling to defend this crucial support, indicating growing weakness in buying pressure.
However, a breakout above the triangle’s resistance line at $2.22, where the 50-day and 100-day simple moving averages converge, would invalidate the bearish outlook. Such a move could propel XRP back toward the $3.00 level, opening the door for a fresh bullish rally.
Key Liquidity Zones Identified on Binance Heatmap
Binance’s XRP/USDT liquidation heatmap highlights major liquidity levels that could influence short-term price direction. A significant cluster of liquidations is seen around the $1.75 mark, making it a key level to watch. If this zone fails to hold, it may trigger a wave of forced liquidations, pushing the price further down toward the next major liquidity concentration at $1.60.
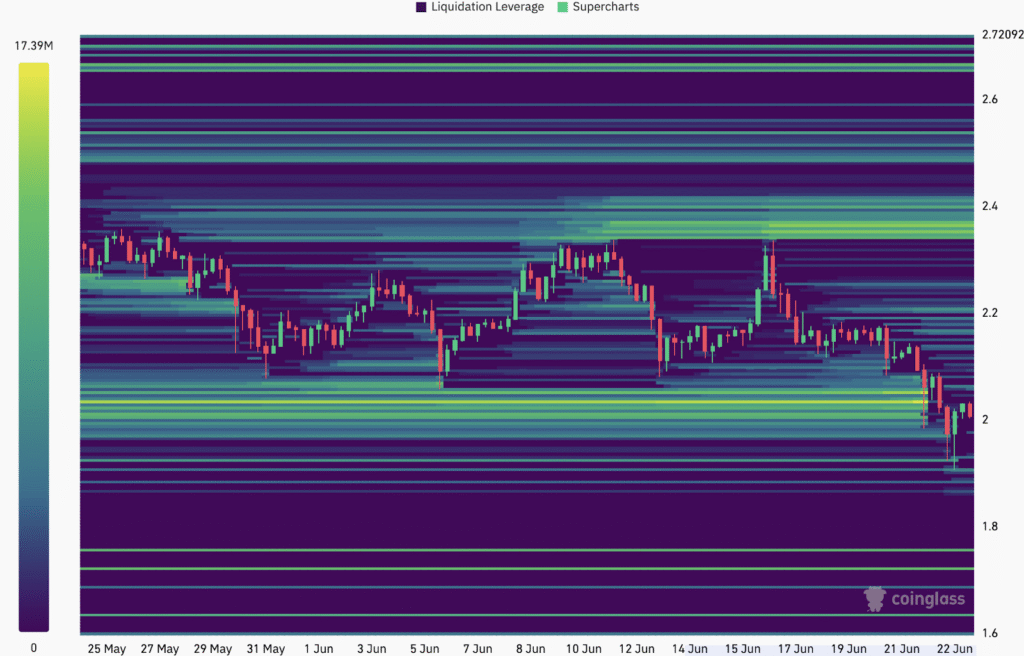
These levels act as pressure points, and once breached, they tend to accelerate market moves as leveraged traders are forced to exit their positions.
Outlook: Bulls Must Defend Key Levels
XRP’s technical structure and market data currently lean bearish, with indicators suggesting that the asset could fall to as low as $1.18 if support at $2.00 fails. The declining open interest, negative funding rates, and looming breakdown of a descending triangle pattern are all warning signs for XRP holders.
However, the situation could quickly reverse if bulls manage to push the price above $2.22. Until then, caution remains warranted, particularly around key liquidity zones like $1.75 and $1.60, which may act as both support levels and potential flashpoints for high volatility.