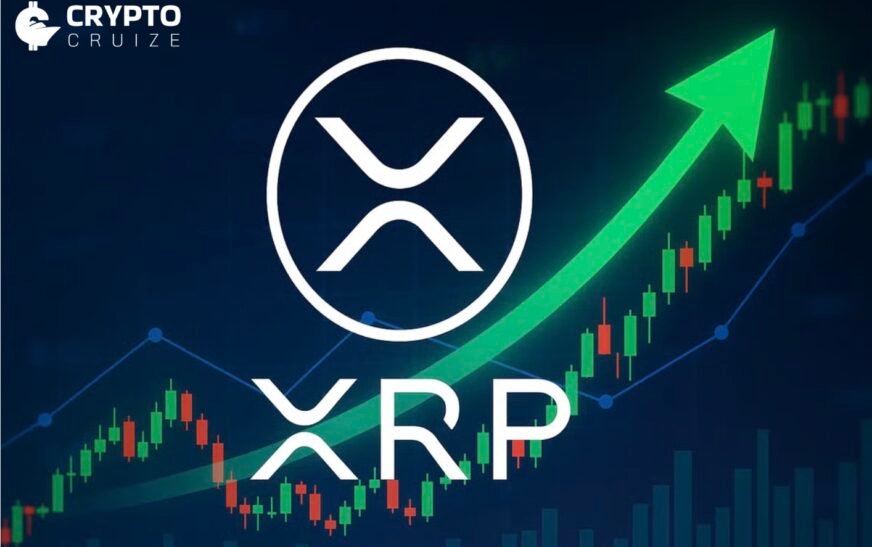
XRP has entered 2026 with renewed momentum, posting an 18.5% gain in the first five days of the year and trading above the $2.16 mark. The rally has come alongside a broader recovery in the crypto market, where total market capitalization has climbed more than 7% year to date, led by Bitcoin and Ether.
Beyond the wider market bounce, XRP is showing signs of strength driven by technical breakouts, long-term accumulation patterns and steady institutional demand. Several indicators now suggest the token could be setting up for further upside in the months ahead, with some projections stretching well beyond its current range.
Below are three key bullish signals that traders and investors are closely watching.
Falling wedge breakout points to trend continuation
One of the clearest technical signals on XRP’s daily chart is a breakout from a falling wedge pattern. This structure typically forms during corrective phases within an ongoing uptrend and often signals a reversal once price escapes the narrowing range.

For several months, XRP traded within the wedge as it printed lower highs and lower lows, reflecting slowing bearish momentum rather than aggressive selling. In early January, the price pushed above the upper trendline of the wedge around the $2.05 to $2.10 zone, suggesting buyers had regained control.
The breakout was supported by improving relative strength, and XRP is now attempting to reclaim important moving averages. The 20-day and 50-day exponential moving averages are being tested, while the 200-day EMA near $2.35 stands as the next major resistance level.
If XRP manages to hold above the former wedge resistance and clears the 200-day EMA, technicians see room for a move toward the $2.60 to $2.70 range by February. That would represent roughly 25% upside from current levels and would confirm that the recent rally is more than a short-term bounce.
Wyckoff reaccumulation structure suggests a larger move
Another bullish signal comes from XRP’s long-term market structure, which some analysts interpret as a Wyckoff reaccumulation pattern. This pattern usually appears mid-trend, allowing large participants to absorb supply before price resumes its upward trajectory.
XRP began forming this structure after bottoming near $1.20 in late 2024. That phase marked the initial stabilization period, known in Wyckoff theory as Phases A and B. Through most of 2025, the token traded sideways below the $1.90 to $2.00 resistance zone, indicating consolidation rather than a breakdown.
In late 2025, XRP briefly dipped below $1.70 before quickly recovering. This move resembles a Wyckoff spring, where price temporarily breaks support to flush out weak hands before reversing higher. The swift rebound signaled selling pressure had largely been exhausted.
As 2026 begins, XRP is testing the descending resistance often referred to as the creek, located around $2.10 to $2.15. A decisive move above this area would confirm a jump across the creek, marking the transition into Phase D of the reaccumulation model.
If this scenario plays out, near-term targets sit between $2.80 and $3.20. Over a longer horizon, some analysts believe a confirmed breakout could eventually open the door to levels near $7, representing a potential multi-hundred percent gain from current prices.
ETF inflows highlight steady institutional demand
While charts point to improving price action, on-chain and fund flow data reveal a quieter but equally important trend. US-based spot XRP exchange-traded funds have continued to attract capital, even during periods of market volatility.
Through December, XRP ETFs recorded inflows for 29 consecutive trading days. On the final Friday of the month alone, net inflows totaled $13.59 million, pushing cumulative inflows since launch to approximately $1.37 billion, according to data from SoSoValue.
Total net assets across these products stand near $1.24 billion. Although daily inflows have eased from early December highs of $30 million to $40 million, the funds still attracted close to $478 million over the month, underscoring sustained institutional interest.
These flows suggest that larger investors are accumulating XRP steadily rather than chasing short-term price spikes. Even as the broader market experienced end-of-year selling pressure, ETF demand remained resilient.
Shrinking exchange balances tighten supply
Adding to the bullish case is a notable decline in XRP balances held on exchanges. On-chain data shows that exchange reserves have dropped to their lowest levels since 2018.
Falling exchange balances typically indicate reduced sell-side liquidity, as fewer tokens are readily available for immediate sale. When combined with consistent demand from ETFs and other long-term holders, this dynamic can create supply constraints that amplify price movements during rallies.

Historically, similar conditions in crypto markets have preceded strong upside phases, especially once broader risk sentiment improves and selling pressure fades.
Long-term outlook points toward higher targets
Major financial institutions are also weighing in on XRP’s potential. Standard Chartered recently reiterated its view that XRP could reach $8 by 2026, citing increased institutional participation and growing acceptance of digital assets as part of long-term capital allocation strategies.
While such targets depend on broader market conditions and regulatory clarity, the convergence of technical breakouts, accumulation patterns and steady fund inflows has strengthened the bullish narrative around XRP as the new year begins.
For now, traders are watching whether XRP can hold above key support levels and convert recent resistance into a base. If it does, the early days of 2026 may mark the start of a much larger move.