


Ethereum (ETH) has once again captured the spotlight in the cryptocurrency market after smashing through its previous all-time high. The second-largest cryptocurrency touched $4,953 on Sunday, 23 August its highest level since 2021, before retreating slightly.
While the quick reversal back below $4,700 might appear concerning at first, many analysts see it as a healthy pause in a broader uptrend rather than the beginning of a downturn. Market data and technical indicators continue to support the case that Ethereum is preparing for another major push, with the psychological $5,000 level now in sight.
A Breakout to New Highs
Ethereum’s explosive rally came after it broke out of a symmetrical triangle pattern on the weekly chart. This technical setup occurs when the price consolidates between a series of lower highs and higher lows, creating a narrowing range. As buyers and sellers battle it out, pressure builds until the price finally breaks out.
In Ethereum’s case, the breakout occurred above the upper trendline, confirming that buyers had gained momentum. This often leads to sharp rallies, which is exactly what unfolded as ETH surged towards its record level.
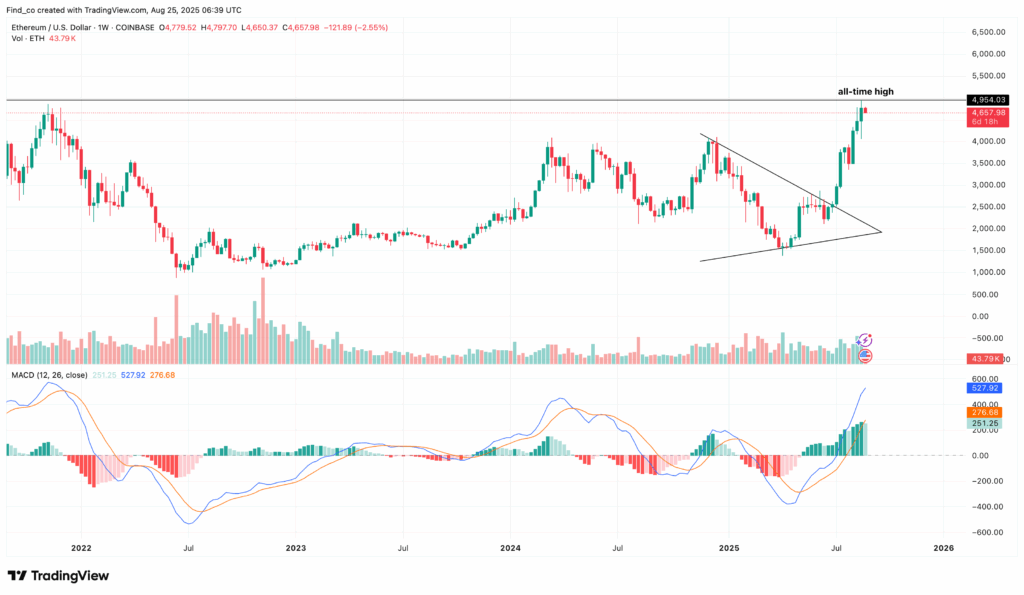
The Moving Average Convergence Divergence (MACD), a key technical indicator, also flashed a strong bullish signal. The 12-day exponential moving average (EMA) crossed above the 26-day EMA, forming what traders call a bullish crossover. This suggests that momentum is shifting in favour of buyers and that the uptrend is still intact.
On-Chain Data Points to Reduced Sell Pressure
Beyond technical patterns, on-chain data also supports the bullish case for Ethereum. According to Glassnode, the net transfer volume of ETH from and to exchanges recorded a figure of -138,656 on the day of the rally.
A negative exchange flow indicates that more Ethereum is being withdrawn from exchanges than deposited. This usually signals reduced sell pressure because coins held in private wallets are less likely to be sold immediately compared to those kept on exchanges.
As long as this trend continues, Ethereum is likely to remain under reduced selling pressure, giving it the room to attempt another breakout above $4,950.

Adding to the momentum, whale wallets particularly on Binance have been accumulating ETH in large quantities. When whales purchase significant amounts of a cryptocurrency, it reduces the available supply on the market while signalling strong confidence in the asset’s long-term potential. Analysts argue that this accumulation could be the fuel Ethereum needs to push decisively past the $5,000 mark.
Short-Term Setup: Bull Flag Points Higher
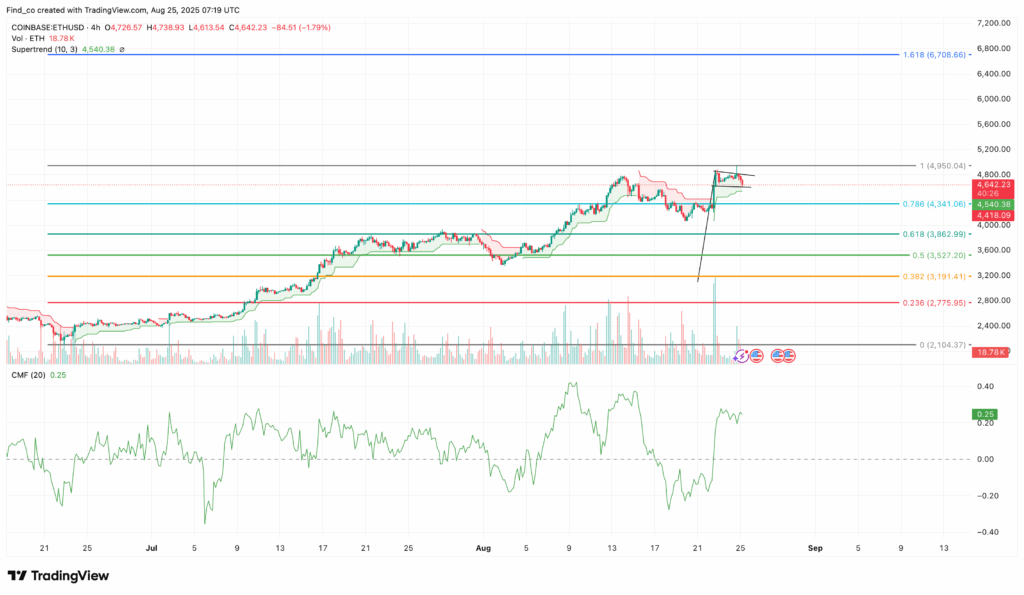
Looking at shorter timeframes, Ethereum appears to be forming a bull flag pattern on the four-hour chart. A bull flag is a bullish continuation setup that often appears after strong upward moves, signalling that another leg higher could follow once consolidation ends.
At the same time, the Supertrend indicator has turned green and flipped below the current price, confirming ongoing buy signals. The Chaikin Money Flow (CMF) has also moved above the zero line, suggesting increasing capital inflows and growing buying momentum.
Together, these indicators strengthen the case for a breakout above $4,950. If ETH manages to push past this resistance, the much-anticipated $5,000 level could be reached sooner rather than later.
Outlook: $5,000 in Sight, $6,700 Possible
Looking ahead, Ethereum’s prospects remain bullish. If the current momentum continues and institutional demand grows, ETH could be on track for much higher levels in this cycle. Analysts suggest that $6,708 could be a realistic next all-time high before the rally slows.
Institutional players such as BlackRock and SharpLink Gaming have been showing interest in Ethereum. If these large investors continue to buy, it could provide additional upward pressure on price and sustain the long-term uptrend.
Of course, risks remain. If selling pressure builds or broader demand weakens, Ethereum’s price could face a setback. In such a case, a pullback to around $4,321 is possible. For now, however, both technicals and on-chain signals suggest that the recent retreat is more of a pause than a reversal.
Ethereum’s journey to new highs is far from over. After briefly retreating from its record $4,953, the cryptocurrency continues to show strong technical and fundamental signals that point to another leg upward.
With reduced selling pressure, whale accumulation, and bullish chart patterns, ETH looks well-positioned to crack resistance at $4,950 and finally cross the $5,000 threshold. If institutional interest strengthens further, this cycle could even carry Ethereum beyond $6,700, a level that once seemed out of reach.


