


In a surprising twist during a sharp crypto market correction, Curve DAO’s native token CRV stood out as one of the few altcoins to hold its ground. While most cryptocurrencies fell by over 4% in under 24 hours, CRV not only resisted the drop but managed to close with a bullish daily candle. This rare strength could be the first signal of a bigger rally to come. Let’s take a closer look at what the charts are telling us.
CRV Holds Steady in a Shaky Market
CRV’s performance during the recent market pullback has caught the attention of many traders and analysts. Historically, tokens that show strength during corrections often become early leaders when the market rebounds. Curve may now be in that position.
Despite pressure from a broader selloff, CRV not only maintained its structure but showed signs of renewed momentum. This suggests that investor confidence in the token is growing and that it could be building the base for a larger move upward.
A Long-Term Range and a Key Resistance Level
CRV has been locked in a horizontal range between $0.42 and $0.83 for nearly three years. Multiple breakout attempts have been made, but each time the price has fallen back into this zone. The most significant deviation occurred between June and November 2024, when the price temporarily dropped to a lower range, triggering concerns of a long-term bearish trend.
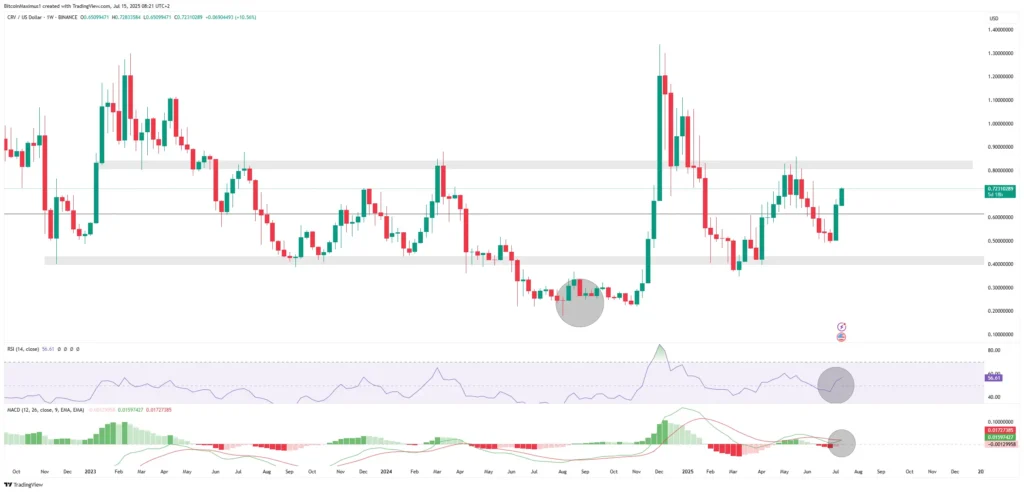
However, that breakdown turned out to be a fakeout. CRV rebounded quickly, reclaimed lost levels, and is now trading in the upper half of the long-term range. This positioning suggests growing bullish pressure and opens the door to a possible breakout above $0.83.
If CRV does manage to break this resistance and hold above it, analysts believe the price could enter a parabolic phase, reaching levels not seen in over three years.
Technical Indicators Point to Upward Momentum
The technical setup currently supports a bullish outlook. Two major indicators, the Relative Strength Index (RSI) and the Moving Average Convergence/Divergence (MACD) are showing strong signals.
The RSI has risen above the neutral 50 level, indicating that buying momentum is building. Meanwhile, the MACD has made a bullish cross, a classic signal that often precedes significant price rallies.
These indicators suggest that a move higher is not only possible but likely if market conditions remain stable or improve in the coming days.
Wave Count Analysis Hints at a Larger Rally
From an Elliott Wave perspective, CRV seems to have completed a five-wave rally followed by a classic A-B-C corrective structure. This structure supports the idea that the current upward movement could be the beginning of a new bullish phase.

If this is indeed the start of a fresh five-wave rally, CRV could target $1 or higher in the coming weeks. Breaking the $0.83 resistance would confirm this scenario and open up room for further gains, potentially signalling the start of wave three, typically the strongest and most explosive phase in Elliott Wave theory.
Curve DAO’s CRV has shown impressive strength amid a volatile market. Trading near the top of its long-standing range and backed by bullish indicators, it’s in a strong technical position. The coming days will be crucial. A confirmed breakout above $0.83 could trigger a powerful rally, possibly taking CRV above $1 for the first time in years.


