
Curve DAO (CRV) has once again captured market attention after enduring a steep 35% correction, leaving traders questioning whether the DeFi token is on the verge of a bullish reversal or headed for another leg down. With price action tightening inside key patterns, CRV is approaching a critical decision point that could set the tone for the rest of 2025.
Weekly Time Frame: A Tale of Two Phases
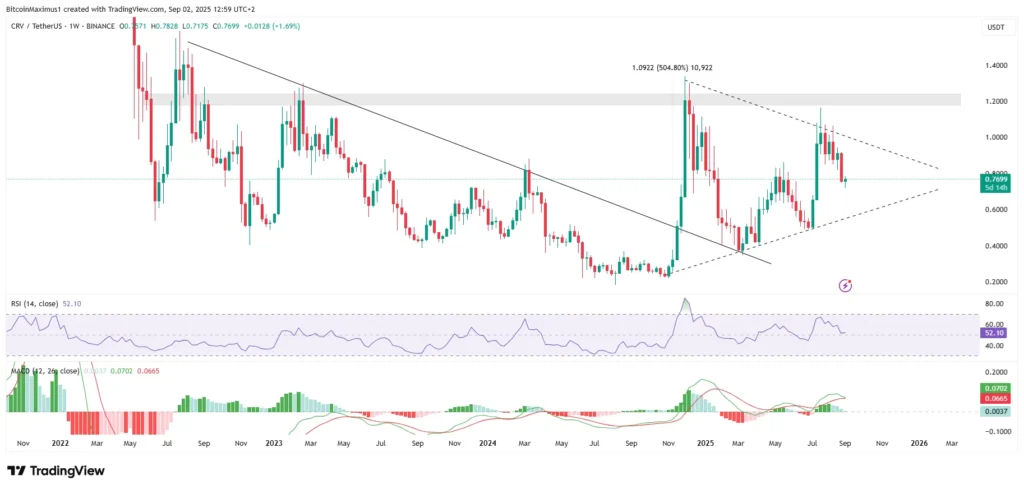
The broader trend for CRV has been marked by wild swings over recent months. In November 2024, the token broke out from a long-standing descending resistance trend line, sparking a parabolic rally. Within weeks, CRV surged nearly 500% to a December high of $1.34, its strongest performance in over a year.
However, the gains proved short-lived. The token quickly retraced, wiping out a large portion of its advance and returning to test the same diagonal resistance line it had previously broken. Since then, CRV has been consolidating inside a symmetrical triangle formation, creating an uncertain outlook for long-term traders.
The weekly indicators add to this ambiguity. The Relative Strength Index (RSI) hovers around the neutral 50 level, while the Moving Average Convergence Divergence (MACD) remains marginally positive but is on the verge of a bearish cross. Together, these signals suggest momentum is balanced, with neither bulls nor bears clearly in control.
Bullish Case: Wedge Breakout in Play
On the daily chart, a potentially bullish setup is emerging. CRV has been moving within a descending wedge since peaking in July. Such formations are typically bullish, often leading to upside breakouts when momentum shifts.
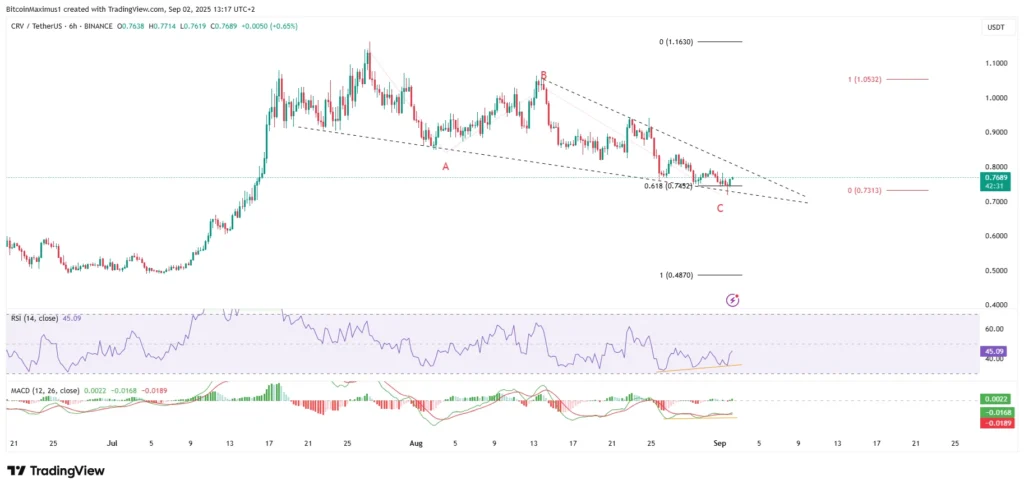
This view is reinforced by Fibonacci analysis. The current correction appears to follow an A-B-C structure, with waves A and C showing equal length. Crucially, the decline halted near the 0.618 Fibonacci retracement level, a common zone for reversals.
Technical indicators also support the bullish thesis. Both the RSI and MACD have generated bullish divergence, indicating waning bearish pressure. If CRV manages to break decisively above the wedge, traders could see a strong rally, potentially revisiting resistance levels near $1.20. A confirmed breakout would also validate this as the completion of the corrective structure.
Bearish Case: Symmetrical Triangle Breakdown Looming
Despite the optimistic signals, the bearish scenario cannot be dismissed. The weekly symmetrical triangle still exerts significant influence over CRV’s trajectory. Importantly, the token has slipped below the horizontal $0.85 support level, which now acts as resistance.
Momentum indicators lean bearish in this scenario. The RSI is trending lower, and the MACD has shown signs of weakening, suggesting sellers remain in control. Under this count, CRV could slide toward the triangle’s lower support line at $0.68. In this case, a breakout to the upside may be delayed until as late as 2026.
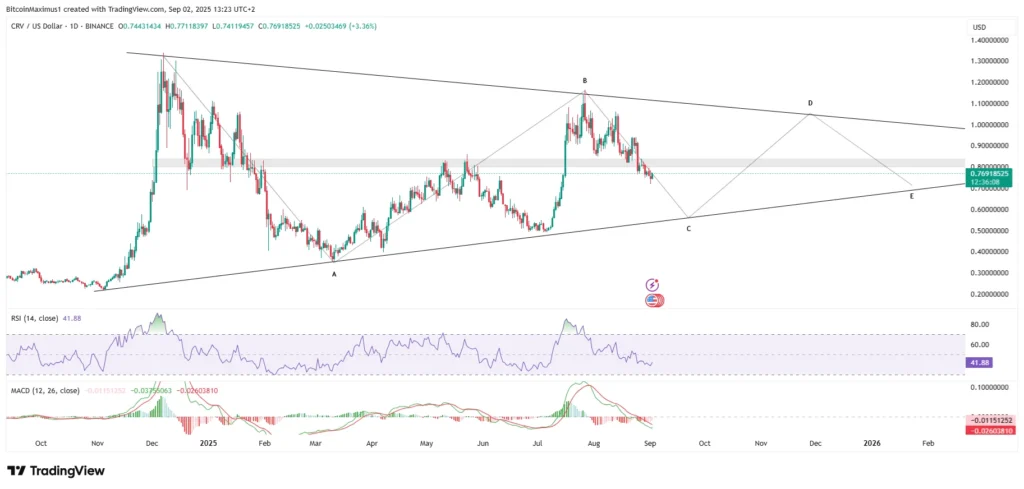
This bearish interpretation aligns with the idea that CRV is still in a prolonged consolidation phase rather than preparing for an immediate trend reversal.
Key Levels to Watch: $0.85 and $1.20
CRV’s short-term future hinges on whether bulls can reclaim the $0.85 level and push the price beyond the descending wedge. A close above this zone could fuel momentum toward the $1.20 resistance, a crucial barrier for any sustainable uptrend.
On the flip side, continued rejection at $0.85 would strengthen the bearish outlook, setting up a potential retest of $0.68 support. Traders are likely to see sharp volatility in either direction as the token approaches this make-or-break point.
Uncertain but Volatile Path Ahead
Curve DAO (CRV) sits at a pivotal juncture where both bullish and bearish wave counts remain valid. The descending wedge points toward a possible breakout, while the symmetrical triangle warns of more downside. Until price action provides a decisive signal, traders should prepare for heightened volatility.
Whether CRV embarks on a recovery rally or drifts lower toward long-term support, the coming weeks will be critical in shaping its trajectory for the remainder of 2025. For now, the market waits as bulls and bears battle for dominance at one of the year’s most closely watched technical levels.