


The cryptocurrency market is at a crossroads. After enjoying a powerful bull run earlier this year, momentum has cooled sharply, sparking concerns of a deeper correction ahead. While technical indicators show the end of the rally may be near, analysts suggest one final leg higher could still play out before the cycle tops out.
From Record Highs to Market Jitters
The global crypto market capitalisation surged by nearly 500% in this cycle, peaking at an all-time high of $4.17 trillion in early August. The rally was one of the strongest in recent years, fuelled by a wave of institutional adoption, growing retail participation, and favourable macro conditions.
However, since reaching that peak, the market has pulled back by more than 10%, shaking investor confidence. The decline, though relatively moderate by crypto standards, has raised the question: is this just a healthy reset within a larger bull market, or the start of a significant downturn?
Several long-term warning signals suggest caution may be warranted.
Technical Warning Signs on the Charts
Chart analysis indicates the total market cap (TOTALCAP) may be in the fifth and final wave of its upward movement. This wave appears to be developing into an ending diagonal, a structure often followed by a sizeable correction.
Adding to the concern, the price structure has formed an ascending wedge, a technical pattern generally considered bearish. Historically, such setups have preceded sharp reversals.
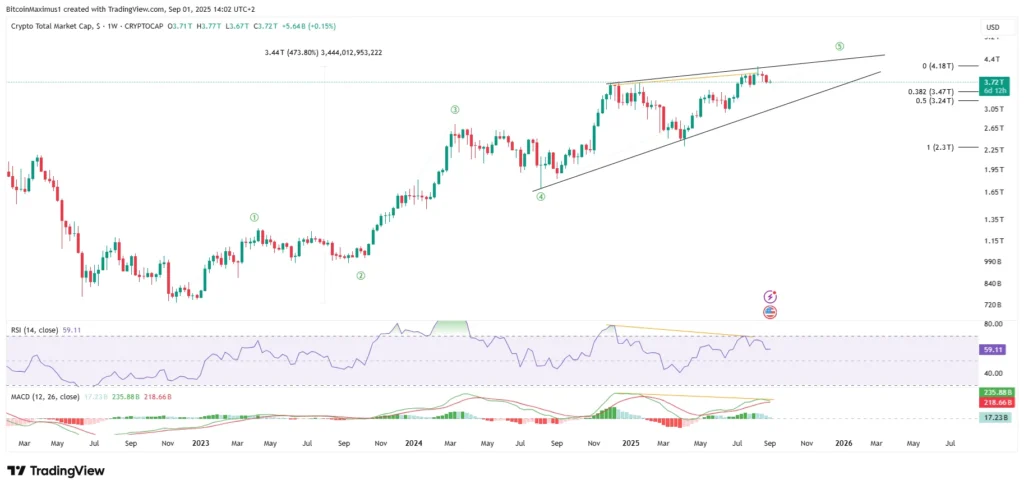
Momentum indicators also paint a troubling picture. Both the Relative Strength Index (RSI) and the Moving Average Convergence/Divergence (MACD) have shown bearish divergences on long-term timeframes. These divergences are rare and often precede trend reversals, particularly when they appear near the end of a fifth wave rally.
Taken together, the signals suggest the market may be close to completing its upward trajectory, with the risk of a significant correction looming.
Short-Term Correction Still in Play
Despite the broader concerns, the current decline appears controlled. The TOTALCAP has been moving within a descending wedge, a corrective pattern that often leads to a bullish reversal. At present, the market is testing the wedge’s support trend line around $3.71 trillion, which coincides with the 0.382 Fibonacci retracement level, a key area of confluence.
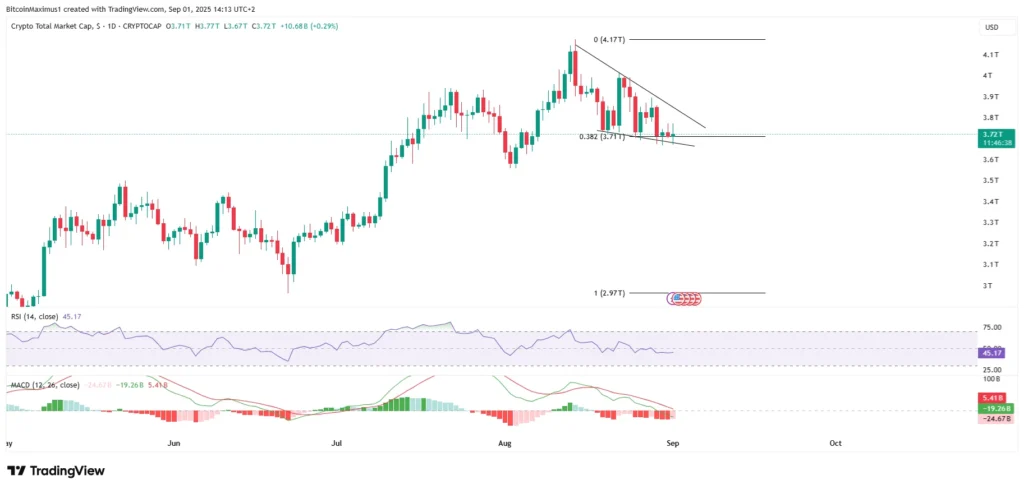
Still, momentum indicators remain weak. Both RSI and MACD are trending lower, indicating that downward pressure has not yet fully subsided. Wave analysis suggests the market is in the final stages of completing wave C of an A-B-C correction.
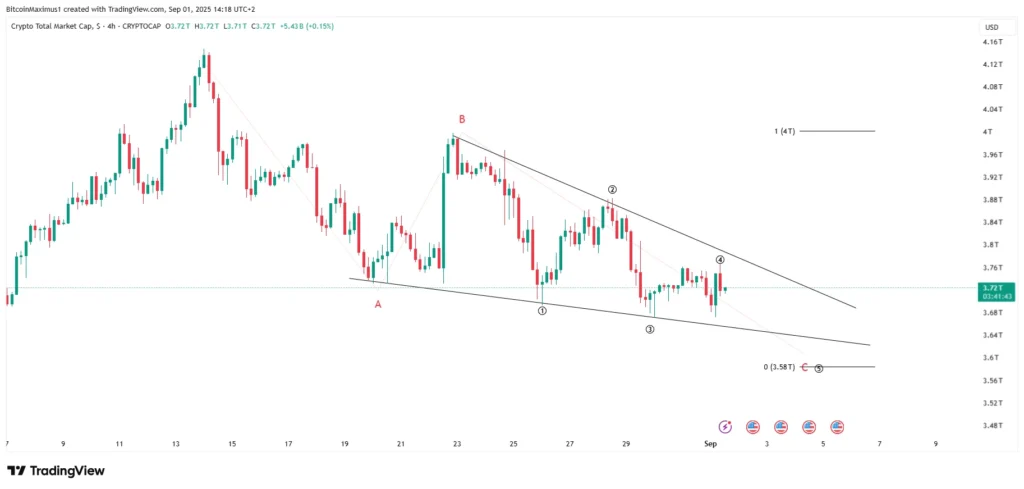
If waves A and C are of equal length, the correction could bottom near $3.52 trillion. This would represent a “throwover” of the descending wedge, a temporary dip below support before a strong rebound. The sub-wave structure supports this view, signalling one last decline before the correction concludes.
What Comes Next for Crypto Investors?
While the short-term bottom may not yet be in place, multiple indicators suggest the correction is nearing its end. Once complete, the market could attempt another push higher, potentially marking the final leg of the bull cycle.
For long-term investors, the confluence of strong support levels around $3.71 trillion and $3.52 trillion may present attractive entry opportunities. However, caution remains essential given the long-term bearish divergences flashing on major indicators.
In the weeks ahead, traders will be watching closely for signs of reversal, particularly a bounce from key support and a recovery in momentum indicators. If these conditions align, the crypto market may still have one last rally in store before a more significant downturn takes hold.
The crypto market finds itself in a precarious position. After a historic run to $4.17 trillion, bearish technical patterns and weakening momentum suggest the current correction is not yet over. However, with several strong supports lining up and a final wave higher still possible, the market may not be done just yet.
Whether this dip marks a temporary reset or the beginning of a larger decline will likely be decided in the weeks to come. For now, investors remain on high alert as crypto navigates its most critical test of the cycle.


