


The crypto market has once again found itself under heavy selling pressure, raising questions about whether this is just another dip or the beginning of a deeper correction. Over the past week, the total market capitalisation fell more than 4%, led by sharp declines in major altcoins such as Ethereum (ETH) and Solana (SOL), which lost over 10% from their recent highs.
Why is the Crypto Market Falling?
The latest crash follows a significant peak in August, when the total market capitalisation (TOTALCAP) touched $4.17 trillion. That high left behind a long upper wick on the weekly chart, forming a “shooting star” candlestick pattern. This is often seen as an early warning sign of fading bullish momentum.
Since then, what began as a small dip has grown into a steep decline. With several days still left before the weekly close, the market risks printing a much larger bearish candle. Analysts say that if selling continues, the next key support zones lie between $3.47 trillion and $3.26 trillion, based on Fibonacci retracements.
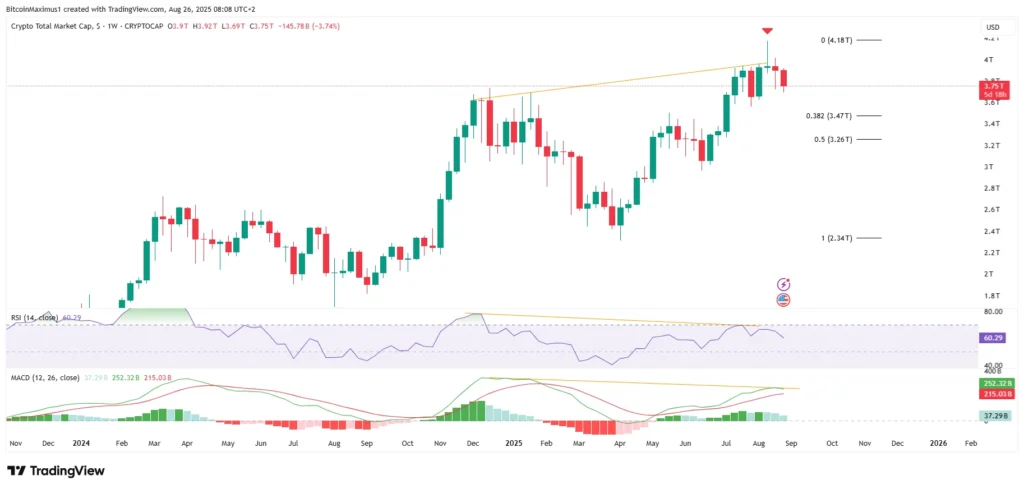
Technical signals also paint a concerning picture. Both the Relative Strength Index (RSI) and the Moving Average Convergence Divergence (MACD) show bearish divergences. If the RSI slips below 50 and the MACD confirms a bearish cross, this could strengthen the case for more downside in the coming weeks.
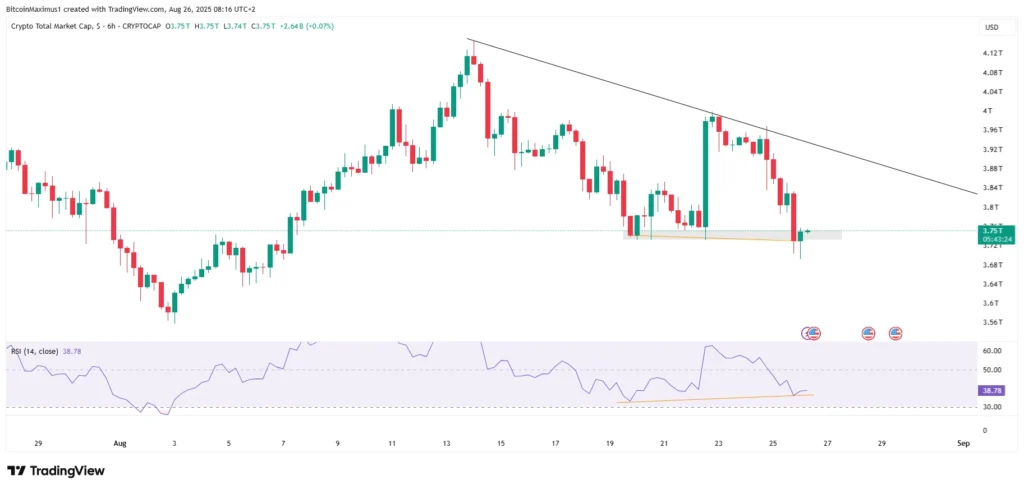
That said, not all signals are negative. On the shorter six-hour chart, TOTALCAP has swept its previous August low, creating a short-term bullish divergence. This suggests the possibility of a relief rally towards the $3.8 trillion resistance zone. However, unless a strong shift in momentum occurs, analysts believe the broader downtrend will likely continue.
Altcoins Take the Hardest Hit
While Bitcoin (BTC) has also dropped, the sell-off has been far harsher for altcoins. The altcoin market cap (ALTCAP) shows no signs of recovery, with several technical patterns pointing towards more losses.
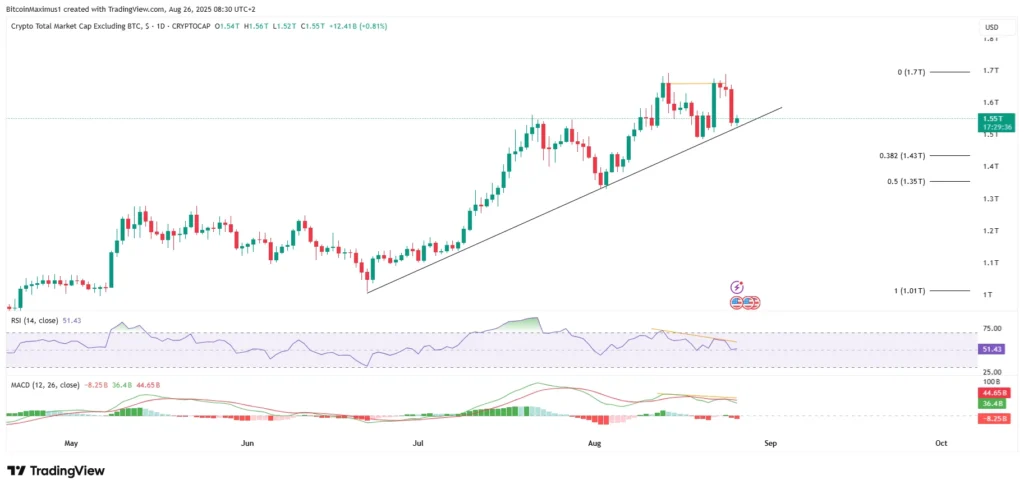
A double top formation appeared in August, combined with long upper wicks and bearish divergences in the RSI and MACD. Currently, ALTCAP sits on an ascending support trend line, but most analysts expect it to break soon. If that happens, the next major support levels could be around $1.43 trillion and even $1.35 trillion.
Once the RSI and MACD decline further, both indicators would confirm the bearish outlook, signalling a possible extended downturn in the altcoin space.
Ethereum Leads the Decline
Ethereum (ETH), often considered the backbone of the altcoin market, has been one of the biggest drivers of the latest fall. ETH recently formed a massive bearish engulfing candlestick, confirming that bullish momentum has cooled.
Like the wider altcoin market, Ethereum’s chart also shows a double top pattern and bearish divergences. Wave analysis suggests that ETH may have completed its third wave in a five-wave uptrend, meaning the correction phase has already started.
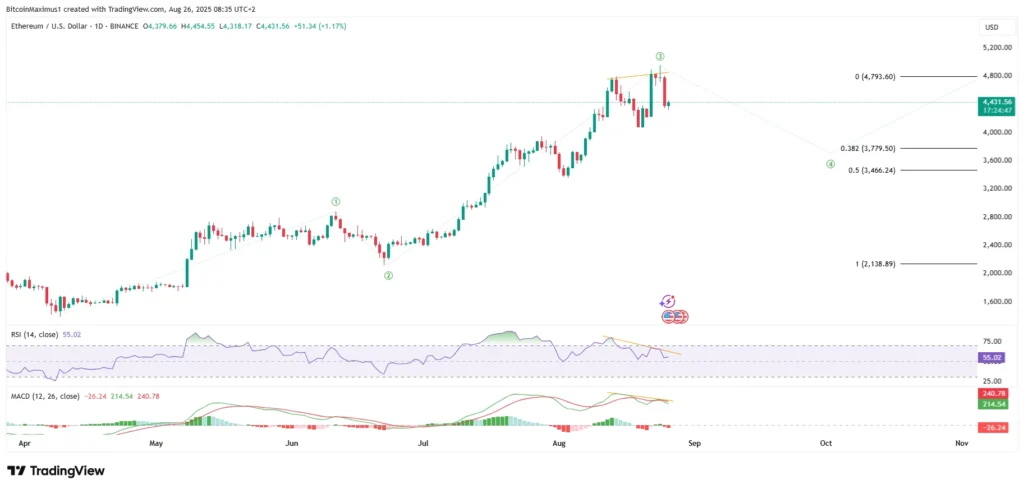
For ETH/USD, the closest support levels sit between $3,446 and $3,780, based on Fibonacci retracements. Meanwhile, the ETH/BTC pair has formed an ascending wedge pattern, which also comes with bearish signals. If ETH breaks lower, it could fall towards ₿0.032 before resuming its upward path.
This means that, in the short term, Ethereum is expected to lose more ground against Bitcoin.
What Comes Next for Crypto?
Looking ahead, the broader market outlook remains tilted to the downside. Technical indicators are weak, bearish divergences remain in place, and key support levels have already been tested.
While a short-term relief bounce is possible, especially if TOTALCAP manages to reclaim the $3.8 trillion zone, most analysts agree that the path of least resistance points lower. The most likely scenario is continued downward pressure, with TOTALCAP potentially sliding towards the $3.26 trillion to $3.47 trillion support range in the coming weeks.
In short, the crypto market is at a critical point. Unless there is a strong reversal in sentiment and momentum, traders should be prepared for more volatility and the possibility of further losses.


