


Bitcoin’s Surge in Active Addresses Hints at Market Bottom
Bitcoin’s increasing on-chain activity suggests the crypto market could be nearing a turning point following its recent correction. Active addresses on the Bitcoin network have surged to a three-month high, indicating a potential shift in market sentiment.
On 28 February, the number of active Bitcoin addresses exceeded 912,300—the highest level since 16 December 2024—when Bitcoin was trading around $105,000, according to data from Glassnode.
Capitulation Could Signal a Reversal
The spike in active addresses could represent a “capitulation moment” for the crypto market, according to blockchain analytics firm IntoTheBlock. The firm noted in a post on X that on-chain activity surges often align with market peaks and bottoms, driven by panic sellers exiting and opportunistic buyers entering the market.
While no single metric can guarantee a price reversal, the data suggests that Bitcoin is at a critical inflection point. Capitulation occurs when investors offload their holdings in panic, causing a sharp price drop. This often precedes the formation of a market bottom before a potential uptrend.
Key Price Levels for Bitcoin’s Momentum
Bitcoin’s ability to hold above the $80,500 threshold could serve as a stabilising factor for the market, according to Stella Zlatareva, dispatch editor at digital asset investment platform Nexo.
“Options data indicates that BTC’s ability to reclaim $80,500 will be a key factor in near-term momentum. A breakout above this level could pave the way for further upside, while a failure to establish it as support may lead to further testing on the downside,” Zlatareva stated.
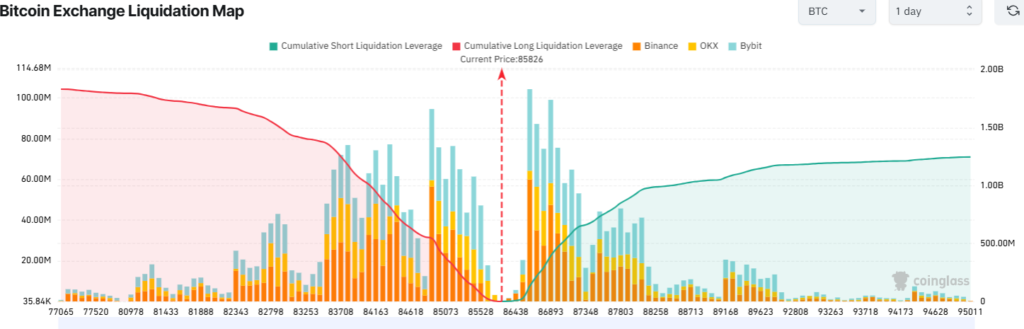
At the same time, Bitcoin may retest this support level if its price falls below $84,000. A decline below this mark would trigger over $1 billion in leveraged long liquidations across all exchanges, according to CoinGlass data.
Bitcoin Nears Oversold Territory
Despite the short-term volatility, Bitcoin’s price is currently closer to forming a market bottom than reaching a local top, according to the market value to realised value (MVRV) Z-score. This technical indicator is used to assess whether an asset is overbought or oversold.
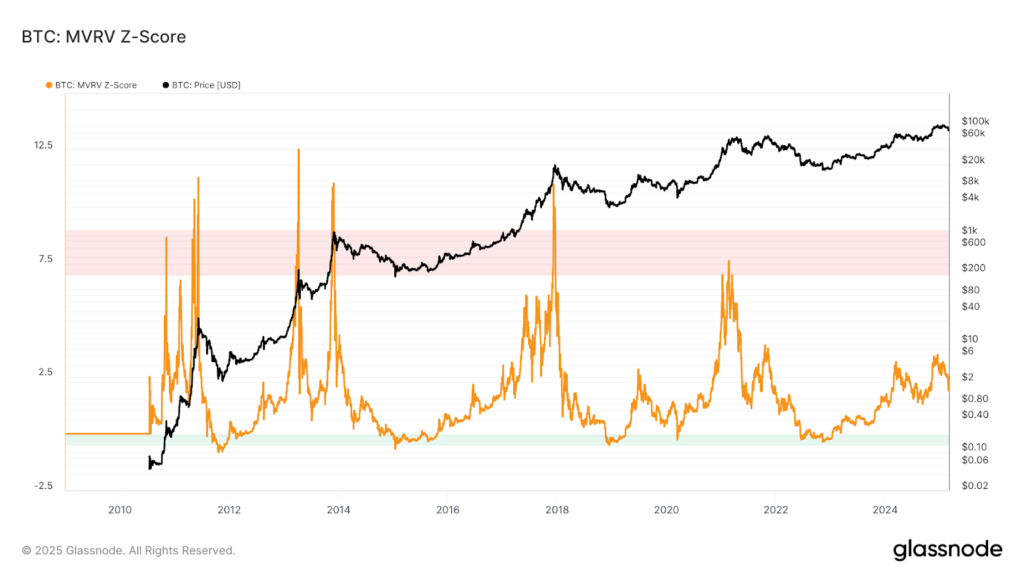
As of 1 March, Bitcoin’s MVRV Z-score stood at 2.01, suggesting that its price is moving towards oversold conditions. Glassnode data indicates that Bitcoin is entering the lower end of the chart’s green zone, a historically significant area associated with market bottoms.
While volatility remains, the latest on-chain activity suggests that the market could be approaching a crucial phase, with Bitcoin’s price movements over the coming days playing a decisive role in shaping its next direction.