
Bitcoin’s surge to an all-time high of $112,000 in 2025 had bulls eyeing the long-anticipated $150,000 target by year-end. However, the rally’s momentum has started to fade, and a sharp correction below $105,000 has sparked concerns of a broader reversal. Technical indicators and fractal patterns from previous cycles are beginning to paint a more cautious picture, casting doubt on the sustainability of this bull run.
Inverse Cup-and-Handle: A Bearish Reversal on the Horizon?
As of June 7, Bitcoin appears to be forming an inverse cup-and-handle pattern, a historically bearish setup. The pattern’s neckline, near the $100,800 level, is acting as a key support zone. BTC has entered the handle-formation phase, which often precedes a breakdown if support fails.
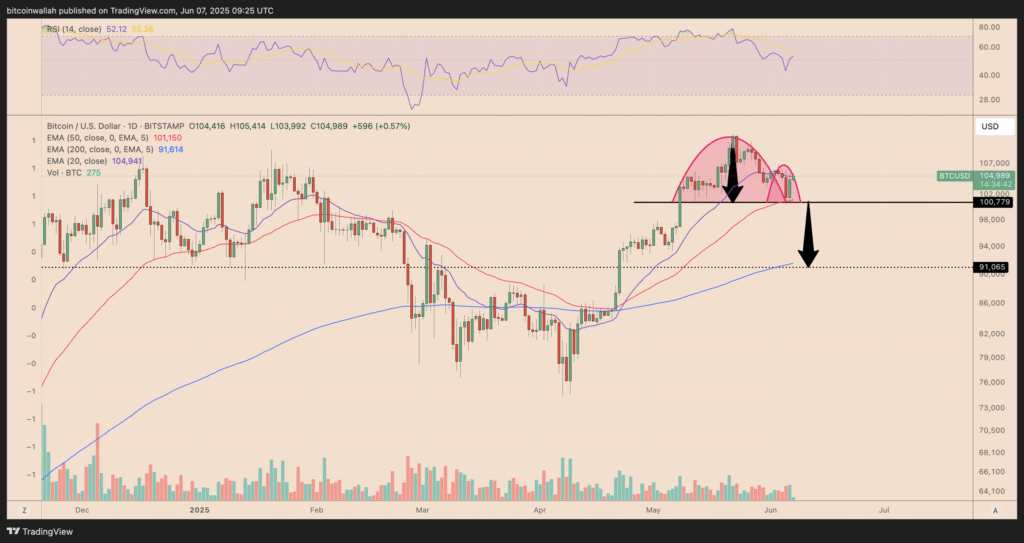
If Bitcoin breaks below this critical neckline, technical projections place the next downside target around $91,000. This zone aligns closely with the 200-day exponential moving average (EMA), a key long-term trend indicator. The price slipping below this level would reinforce a bearish outlook and may eliminate hopes of a quick rebound toward the $150,000 mark.
Adding to this concern is the relative strength index (RSI), which has declined to 52. A further drop below the neutral 50 level could intensify selling pressure. RSI trends suggest that bearish sentiment is gaining ground, and trader conviction in a short-term rebound is weakening.
RSI Divergence Echoes Market Top Patterns
On a broader weekly timescale, Bitcoin is flashing a warning signal eerily similar to its 2021 cycle top. A bearish RSI divergence has developed, where prices push higher while RSI trends lower, typically a sign of waning momentum and an impending correction.
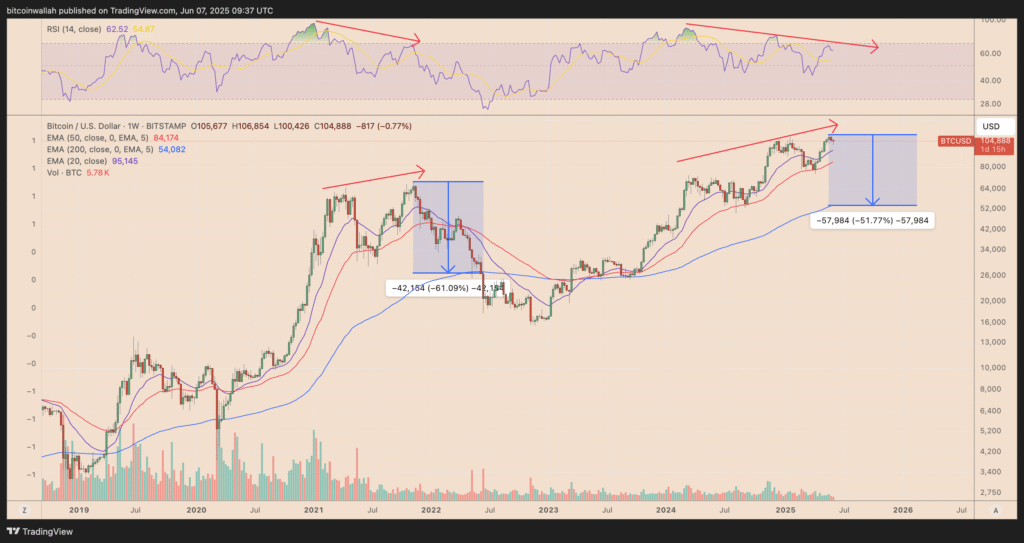
Back in 2021, this divergence preceded a dramatic 61% correction, dragging Bitcoin’s price down toward its 200-week EMA. Currently, the 200-week EMA stands near $64,000, and the current setup projects a potential 52% decline from recent highs if history repeats. This possibility places the bullish $150,000 year-end target under significant threat.

Veteran trader Peter Brandt has further raised concerns by identifying a rising wedge pattern, another historically bearish formation. Brandt warns that unless Bitcoin reclaims its parabolic trendline soon, the current bullish cycle could be nearing its end, potentially triggering a typical 50–60% drawdown seen in previous tops.
Gold Comparison and On-Chain Strength
Despite mounting technical warnings, not all analysts are convinced of a bearish reversal. Some traders draw parallels between Bitcoin’s current market setup and gold’s breakout in the early 2000s. This comparison has fueled speculation that BTC may still have room to run, possibly replicating gold’s explosive gains.
Analyst Tony Severino has pointed to a possible bull flag structure, a continuation pattern that could propel prices sharply higher. According to him, a breakout from the flag could trigger a rally toward the $150,000 level.
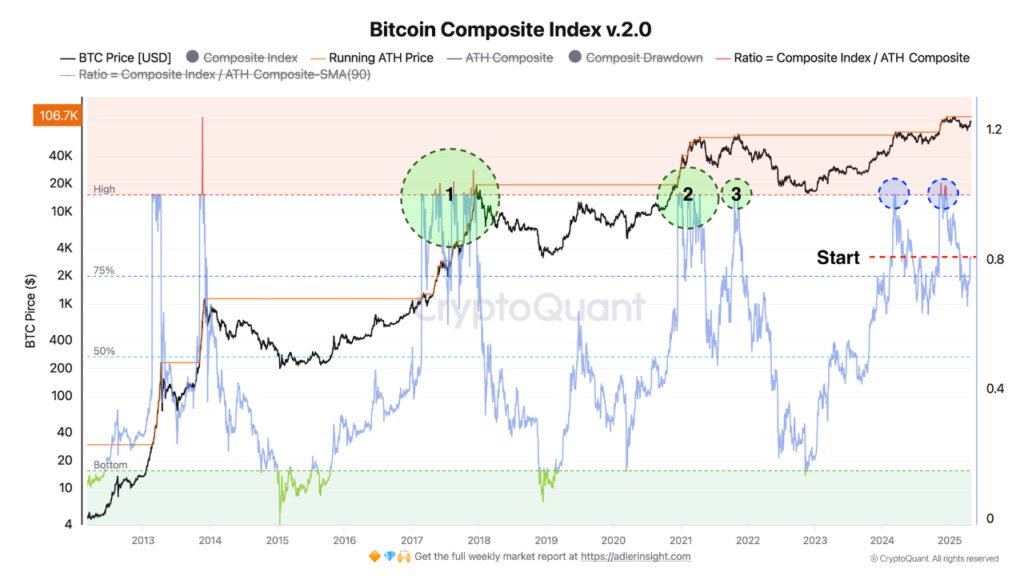
On-chain signals add further weight to this optimism. Researcher Axel Adler Jr. highlights that Bitcoin is nearing a critical “start rally zone.” If key metrics like the Net Unrealized Profit/Loss (NUPL) and the Market Value to Realised Value (MVRV) ratio break above 1.0 and sustain the level, a new bullish impulse may be underway, similar to 2017 and 2021 cycles.
Cautious Optimism or Impending Top?
Bitcoin’s path to $150,000 remains possible but increasingly uncertain. While historical fractals and technical setups hint at a potential market top and correction, bullish structures and on-chain data offer hope for continued upside.
The $100,800 support level and RSI trends will be crucial in determining the short-term direction. A decisive move above $105,000 may reignite bullish momentum, while a drop toward $91,000 could mark the end of the current rally. As the market stands at a critical juncture, investors should prepare for volatility and stay alert to both warning signs and breakout triggers.