
Bitcoin’s price has seen a significant upswing, climbing over 5% in the past 24 hours to reach a high of $83,786 on March 12. The cryptocurrency rebounded strongly from a recent local low of $76,450, signalling a bullish technical setup across multiple timeframes.
Technical Strength Holds Firm
On the weekly chart, Bitcoin successfully retested its 50-week exponential moving average (50W-EMA) as a support level. This key indicator, which has historically provided strong support, has held firm since August 2023, reinforcing Bitcoin’s long-term bullish outlook.
In September 2024, BTC similarly bounced off this trendline before pushing to new all-time highs. Its continued position above the 50W-EMA suggests that bullish momentum remains intact.
Bullish Divergences Indicate Upward Momentum
Before its latest rally, Bitcoin’s price action showed multiple bullish divergences between the price and the relative strength index (RSI) indicator across both lower and higher timeframes.
A bullish divergence occurs when the price records a lower low while the RSI forms a higher low, signalling potential trend reversals. Notably, bullish divergences appeared across the 15-minute, 1-hour, 4-hour, and 1-day charts, indicating a growing bullish momentum.
The RSI also dipped into oversold territory, dropping below 30 before rebounding. This suggests that selling pressure has weakened, with buyers stepping in to drive the price higher.
Historical data supports the significance of such divergences. Since 2020, Bitcoin has exhibited this technical setup only six times, each marking a market bottom. The most recent instance occurred between July and August 2024, which led to a substantial price recovery.
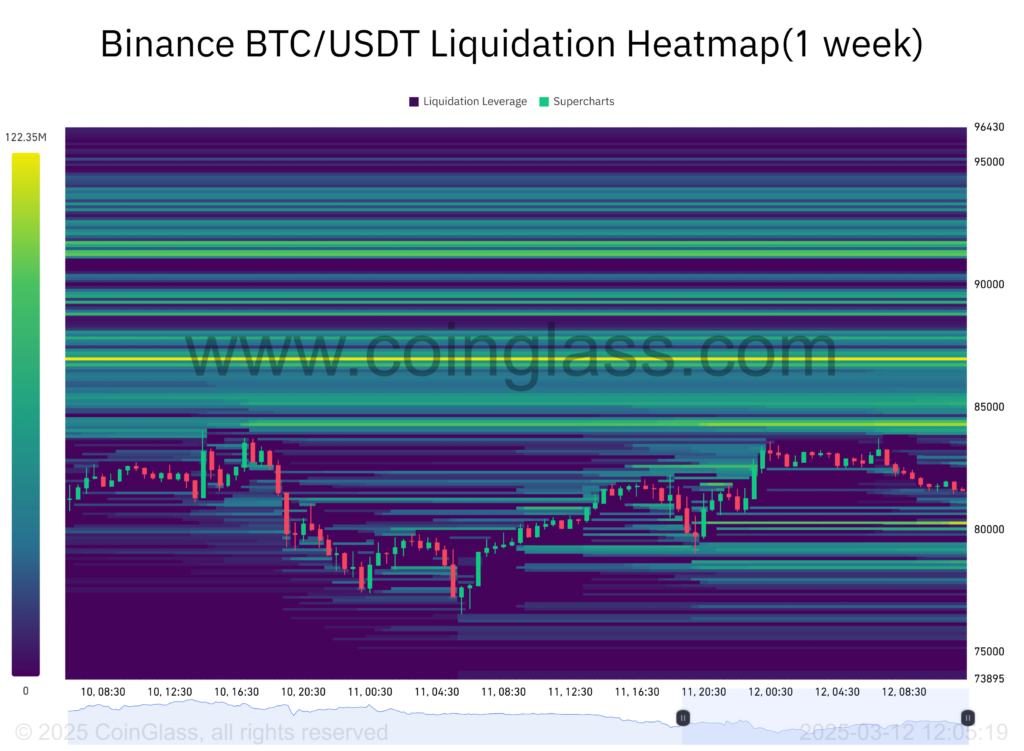
Liquidity and Price Targets
Bitcoin’s rally was further fuelled by liquidity movements. After briefly dipping below its previous low of $78,150, BTC swept the downside liquidity, allowing for a strong rebound above the $80,000 mark.
According to liquidation heatmaps, over $250 million in leveraged positions remain between $85,000 and $87,000. This concentration of liquidity suggests that Bitcoin could continue its upward trajectory toward this range in the coming days.
Inverse Head and Shoulders Pattern Hints at $88,000 Target
On the 1-hour chart, Bitcoin has formed an inverse head and shoulders pattern, a classic bullish setup. If BTC manages to close above the neckline at $83,800, it could trigger a further 7% price increase, pushing the value toward $89,000.
This target aligns with key Fibonacci retracement levels, specifically the 0.50 and 0.618 Fib levels, which range between Bitcoin’s previous lower high of $96,450 and lower low of $76,560.
However, the bullish outlook would be invalidated if Bitcoin’s price falls below $78,500, disrupting the current higher-high structure on the lower timeframe.
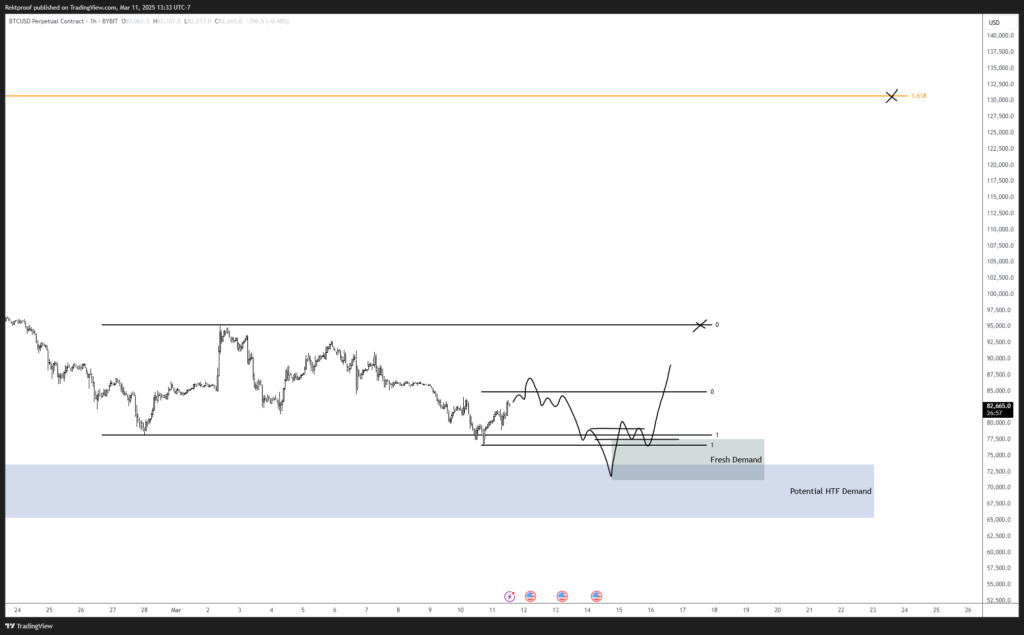
Potential Consolidation Before a Pullback
Crypto analyst RektProof has suggested that BTC may consolidate near its overhead resistance between $86,000 and $88,000. However, a strong demand zone remains between $70,000 and $74,000, indicating that a potential price correction could follow in the coming days or weeks.
For now, Bitcoin’s bullish momentum appears strong, but traders will be watching closely to see if it can maintain its gains or face a retracement in the near future.