Bitcoin’s meteoric rise past the $100,000 milestone has quickly soured, as the flagship cryptocurrency struggles to maintain its footing above crucial technical levels. After reaching a record high of $126,110, Bitcoin (BTC) has tumbled below $109,500, a level that previously acted as both resistance and support throughout 2025.
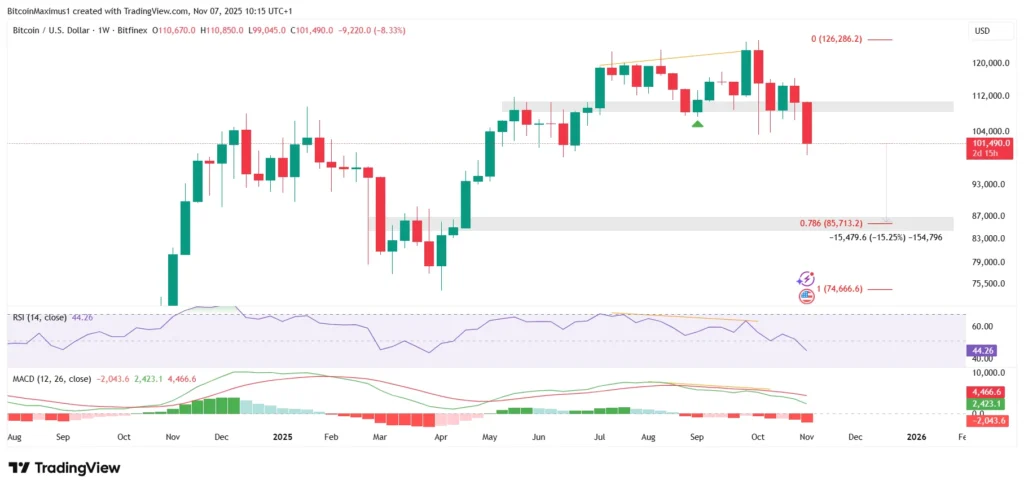
This breakdown marks a significant turning point in the current market cycle. The weekly close below $109,500 suggests that the support has failed, opening the door to deeper losses. Technical analysts now eye the next major support near $85,700, which aligns with both a horizontal and Fibonacci retracement zone.
Unless BTC swiftly reclaims the $109,500 threshold, market sentiment is expected to remain bearish. Traders and long-term holders alike are now bracing for further downside volatility as technical momentum indicators continue to flash red.
Technical Indicators Confirm Bearish Momentum
The recent correction has been reinforced by bearish signals across multiple key indicators. Both the Relative Strength Index (RSI) and the Moving Average Convergence/Divergence (MACD) have turned decisively negative.
The RSI’s drop below the neutral 50 level suggests weakening buying pressure, while the MACD has formed a bearish crossover, signalling that downward momentum is likely to persist. Analysts note that these indicators have also printed bearish divergences, a pattern historically seen before deeper market corrections.
Adding to the pessimism, the monthly candlestick for October has taken the form of a shooting star, a classic reversal signal that often marks the end of a bullish phase. This, combined with the confirmation of an ascending wedge breakdown, indicates that the broader uptrend from November 2022 may have reached its exhaustion point.
Wave Count Analysis Hints at a Completed Cycle
Bitcoin’s broader wave structure supports the case for a corrective phase. Analysts tracking Elliott Wave patterns suggest that the five-wave upward move initiated in late 2022 has now been completed. The fifth and final wave, formed within an ascending wedge (an ending diagonal), has already broken down, signalling the conclusion of the bullish cycle.
According to this interpretation, the market could now be entering a prolonged corrective phase, with prices potentially retracing towards $85,700 before stabilising. Historically, such structural breakdowns have triggered extended bearish periods lasting several months.
On the monthly time frame, the RSI and MACD have both produced bearish divergences, reinforcing the theory that Bitcoin may have peaked for this cycle. Previous occurrences of these signals have consistently preceded sharp market reversals, lending weight to the bearish narrative.
A Bullish Case Still Lingers, But Weakly
While the dominant trend remains bearish, a minority of analysts see the potential for a bullish corrective setup. This alternative view suggests Bitcoin could be completing an A-B-C corrective pattern, with the current move representing the final leg of an irregular flat formation.
If accurate, Bitcoin may only experience a modest dip below $98,900 before resuming its uptrend. The completion of this wave structure would form a descending wedge, often seen before bullish reversals. A successful breakout from this wedge could trigger a retest of the $110,000 region.
However, despite this theoretical setup, momentum indicators show no signs of reversal. Both the RSI and MACD remain firmly in bearish territory, providing little evidence that a recovery is imminent. For now, optimism remains speculative and unsupported by technical confirmation.
Bitcoin Dominance Strengthens Amid Market Uncertainty
While Bitcoin’s price struggles, its market dominance (BTCD) has begun to rise, a trend that typically occurs when traders move away from altcoins into Bitcoin during risk-off periods.
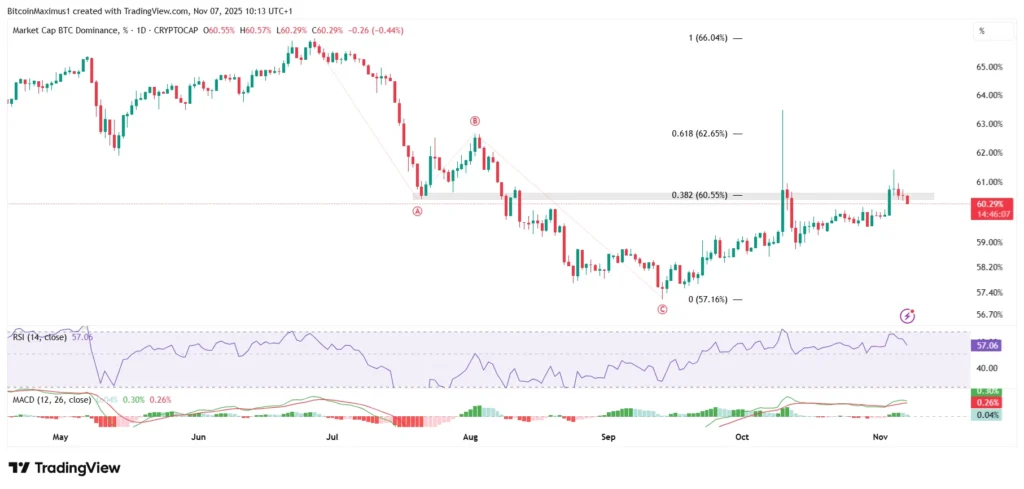
The dominance metric recently broke above 60.55% resistance, turning the level into new support. This breakout, combined with bullish readings on both the RSI and MACD, suggests Bitcoin’s dominance could extend toward the 62.65% Fibonacci resistance level in the coming weeks.
A continued rise in dominance often coincides with weaker performance in the altcoin sector, indicating that capital is consolidating around Bitcoin despite the broader bearish climate.
Outlook: A Crucial Test for Bitcoin’s Bulls
Bitcoin’s sharp reversal below $109,500 signals a loss of short-term bullish control and raises the likelihood of a deeper retracement toward $85,700. Momentum indicators and wave structure analysis both support this bearish trajectory, suggesting the current cycle top may already be in place.
For bulls, reclaiming $109,500 is now the defining challenge. Without a decisive recovery above that level, the market is expected to remain under selling pressure well into the year’s end.
Until clear reversal signals emerge, traders should brace for heightened volatility and potential further downside, marking a critical phase in Bitcoin’s ongoing price cycle.