Bitcoin’s Hash Ribbons indicator has issued a new “buy” signal at around $90,000, raising hopes of a potential price recovery even as miners remain under pressure and market sentiment stays uncertain. The on-chain metric, tracked by Capriole Investments, has now flashed this signal five times in 2025, reinforcing its reputation for spotting long-term market bottoms.
A Rare Buy Signal Reappears
The Hash Ribbons indicator identifies periods of miner capitulation followed by recovery. It does this by analysing the relationship between the 30-day and 60-day moving averages of Bitcoin’s hashrate. A buy signal typically appears when miners begin to recover after an extended period of difficulty.
The latest reading shows the 30-day hashrate average dropping below the 60-day average, marking a phase of miner stress. Historical data suggests that similar moments often align with discounted prices and strong long-term buying opportunities.
CryptoQuant analyst Darkfost noted that the latest signal does not mean traders must immediately enter the market. The indicator instead highlights phases where miners face financial pressure. In the short term, such conditions often lead to increased selling as miners attempt to meet operational costs. Over longer periods, however, this forced supply has traditionally provided favourable entry points for committed investors.
Miners Increase Selling Activity
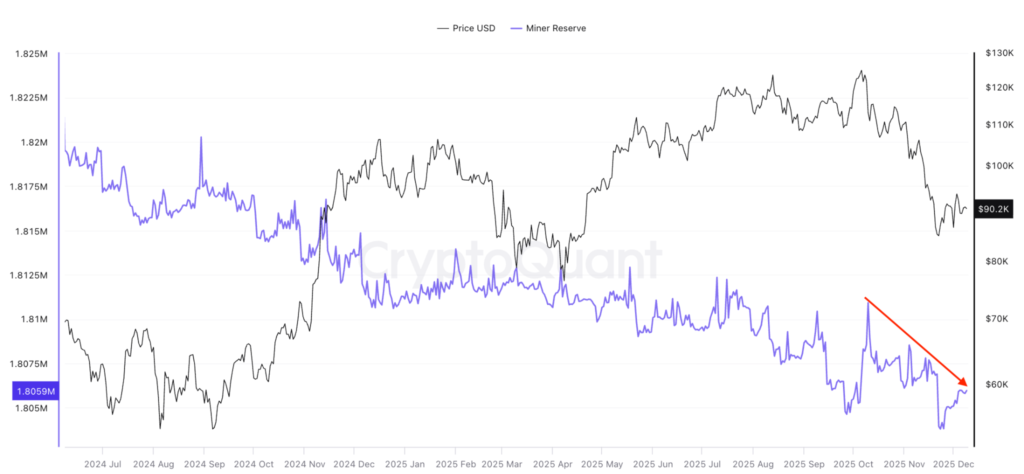
Although overall miner reserves remained relatively stable through most of 2025, selling pressure has risen since early October. Known miner wallets currently hold about 1.8 million BTC, which is roughly 5,000 fewer coins than they held on 10 October. Analysts view this increase in miner distribution as a key contributor to the recent decline from the $126,000 all-time high to as low as $80,500 on 21 November.
This trend reinforces the Hash Ribbons signal, which is designed to show when miners are forced to liquidate at scale. Historically, such sell-offs have preceded strong accumulation phases and eventual price recoveries.
Bitcoin Trades Between Conflicting Trendlines
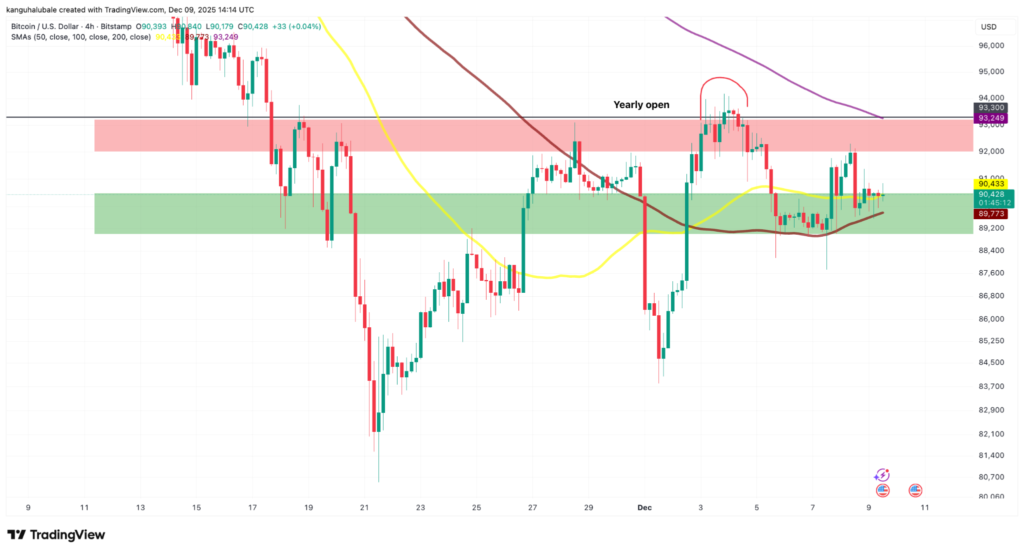
Bitcoin’s price remains trapped between major levels that reflect market indecision. Recent attempts to climb higher were rejected near the yearly open of $93,300, a region that aligns with the 200-period simple moving average on the four-hour chart. This area now acts as a significant resistance zone.
On the lower end, Bitcoin continues to find support in the $89,000 to $90,500 range. The 50 and 100 simple moving averages currently sit within this zone, strengthening it as a key defence level for buyers.
For Bitcoin to break out of its current downtrend, it must close above $92,000 with strong momentum. Clearing the 200-period moving average would increase the probability of a recovery toward the $100,000 region. Until then, traders expect continued sideways movement with moments of volatility driven by miner activity and macro sentiment.
Downside Risks Remain in Play
While the Hash Ribbons signal offers a bullish long-term perspective, bears still hold short-term control. Analysts warn that a breakdown below $90,000 could trigger deeper losses. If the current support range fails to hold, the next major zone lies far lower. Some models suggest that an extended sell-off could push Bitcoin’s price toward $40,000, although this remains a worst-case scenario rather than a base expectation.
Market observers now await whether buyers respond to the Hash Ribbons signal, which has historically aligned with major reversals. With miner stress easing slowly and Bitcoin consolidating near a critical zone, traders are watching closely to see whether this signal sparks renewed upward momentum.