


BNB is showing renewed strength after rebounding more than thirteen percent from a recent dip near eight hundred dollars. The token briefly traded above nine hundred ten dollars on Wednesday and is now positioning itself for a potential move back toward the one thousand dollar mark in December. A combination of chart patterns, liquidation data and a confirmed technical breakout has strengthened the short term bullish narrative.
Double Bottom Pattern Signals a Push Toward $1,020
BNB has formed a developing double bottom on the four hour chart within the eight hundred to eight hundred twenty dollar demand zone. This structure appears when price prints two similar lows before reversing higher, indicating weakening selling pressure. The token bounced firmly from the second low and is now challenging the neckline near the nine hundred to nine hundred twenty dollar region.
A clear breakout above this neckline would confirm the pattern and open a path toward approximately one thousand twenty dollars, which aligns with the zero point three eight two Fibonacci retracement level. If BNB fails to hold above the neckline, the bullish scenario weakens and the price may drift back toward support at the twenty and fifty period exponential moving averages near eight hundred sixty dollars.
Liquidation Cluster Favouring a Move to $1,020
Data from CoinGlass highlights a significant short liquidation cluster of more than one hundred twelve million dollars near the one thousand twenty dollar level. Liquidation heatmaps help identify zones where leveraged traders could be forced to exit positions. The presence of concentrated short positions suggests that many traders are betting against BNB around current prices.
If the price continues to climb, these shorts may be closed automatically, prompting forced buying activity. This process can accelerate upward momentum and draw the price toward the liquidation cluster. In the current market environment this dynamic strengthens the likelihood of BNB testing one thousand twenty dollars in December.
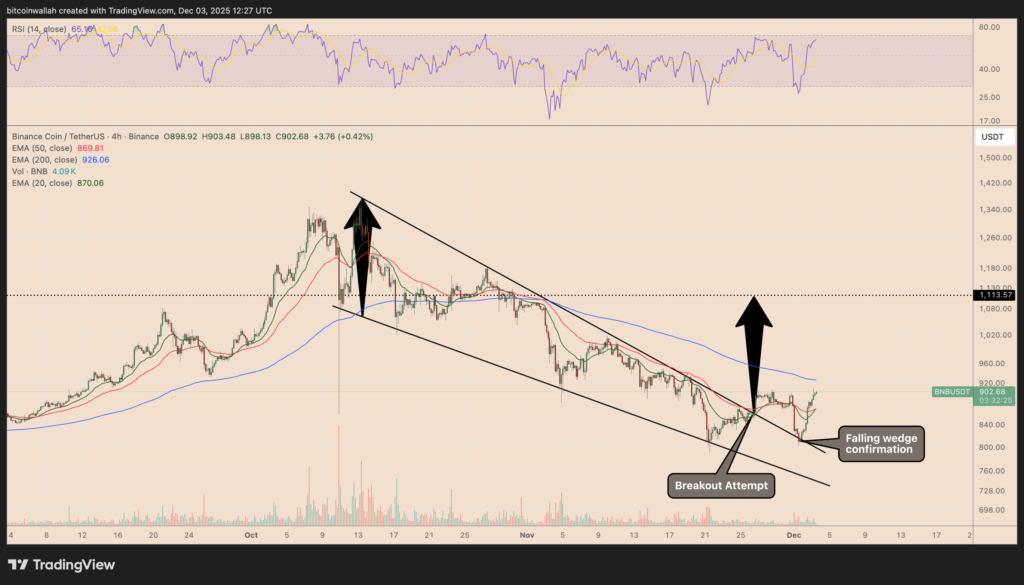
Falling Wedge Breakout Strengthens Bullish Momentum
BNB recently broke out of a multi week falling wedge. This pattern often resolves upward following a prolonged decline. The break above the descending upper trendline in late November was followed by a brief pullback to retest the former resistance as support. The bounce from this retest indicates that buyers are regaining control and confirms the validity of the breakout.
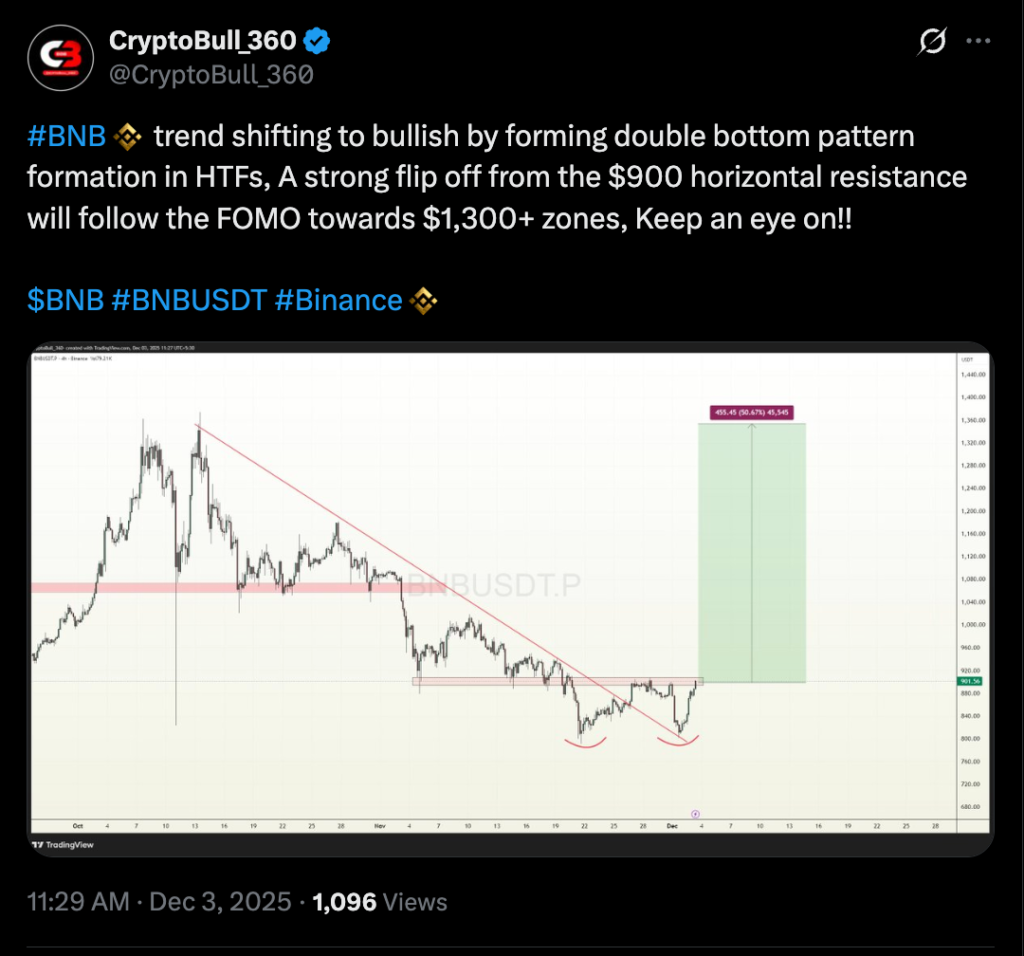
The measured target of the wedge points toward the one thousand one hundred to one thousand one hundred fifteen dollar zone in December if momentum continues. Market watcher CryptoBull_360 has projected even higher levels, suggesting the token could reach one thousand three hundred dollars or more. A failure to maintain support above the breakout level would challenge the bullish case and potentially trap traders who entered during the breakout.
Support Above $900 Remains the Key to the Rally
BNB’s ability to stay above nine hundred dollars in the near term is likely to determine whether the current bullish structure holds. A sustained move above this zone would validate both the double bottom breakout and the falling wedge recovery. This scenario increases the chances of revisiting the one thousand dollar region followed by an extension toward one thousand twenty dollars and possibly beyond. A breakdown below nine hundred dollars would undermine the current setup and expose the token to further consolidation.


