Bitcoin’s latest rally has once again faltered at the $110,000 mark, marking the third rejection at this level and putting bullish momentum under pressure. The cryptocurrency briefly traded at $109,100 on Thursday, but significant resistance just above continues to hinder progress.
Analysts now warn that the longer BTC fails to break above this key psychological barrier, the greater the risk of a deeper price correction in the short term. The resistance zone between $110,000 and $112,000 remains a formidable challenge for bulls hoping to push Bitcoin into a new phase of price discovery.
Bitcoin Faces Resistance at $110,000
The latest stall comes after strong US employment data triggered broader market hesitation. Bitcoin’s repeated inability to hold above $110,000 has drawn attention to the overhead resistance, with $112,000 identified as the next major barrier.
The BTC/USD pair has been consolidating for several months, and traders were hopeful that a clean breakout would finally occur. However, the lack of momentum has left Bitcoin vulnerable, as bears continue to defend the $110,000 level with conviction.
Historical Patterns Point to Potential Correction
History suggests that multiple rejections at key resistance levels often precede sharp declines. A notable example occurred in January 2025, when BTC was rejected several times at $107,000, just below the all-time high of $109,000, before falling by 14% over the following two weeks.
Similarly, Bitcoin experienced an 18% drop within 10 days of failing to break past the $72,000 level earlier in March 2024. If such patterns repeat, analysts say Bitcoin could drop by 14–18% from current levels.
Technical Indicators Signal Bearish Pressure
Technical signals are reinforcing the bearish outlook. A bearish divergence in the relative strength index (RSI) has emerged, a pattern where Bitcoin’s price makes higher highs while RSI forms lower highs. This divergence often precedes downturns.
Additionally, data from futures markets shows neutral funding rates and significant sell volumes near $110,000, suggesting that many traders are taking profits or hesitating to open new long positions. These indicators point toward a possible pullback in the near term.
Key Support Levels to Watch
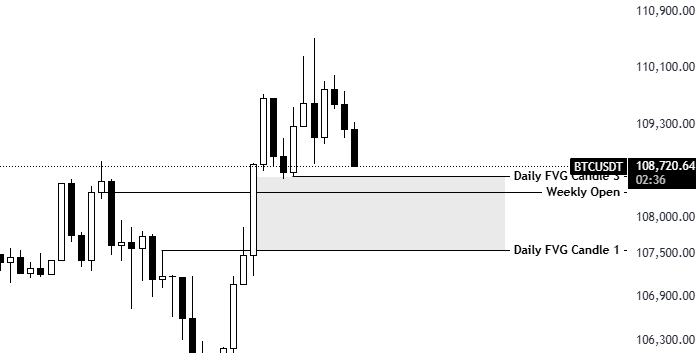
Should the correction unfold, several support levels could come into play. The first area of interest lies between $107,500, where the 50-day simple moving average (SMA) sits, and $106,000, which sees the convergence of both the 100-day and 200-day SMAs.
Further down, another support zone stretches from the local low at $105,200 to the psychological level of $104,000. A break below these zones could accelerate the decline.
Pseudonymous trader KillaXBT noted that holding the $108,000–$107,500 support range would be critical. “Hold = I TP my short and aim for a sweep of ATH this month,” the trader said, suggesting that maintaining support could still open the door for a fresh rally.
Short Squeeze Possible Above Resistance
Despite the bearish sentiment, there remains the potential for a short squeeze if Bitcoin breaks cleanly above $110,000. According to CoinGlass data, the largest cluster of short liquidations, worth around $121 million, lies just above this level.
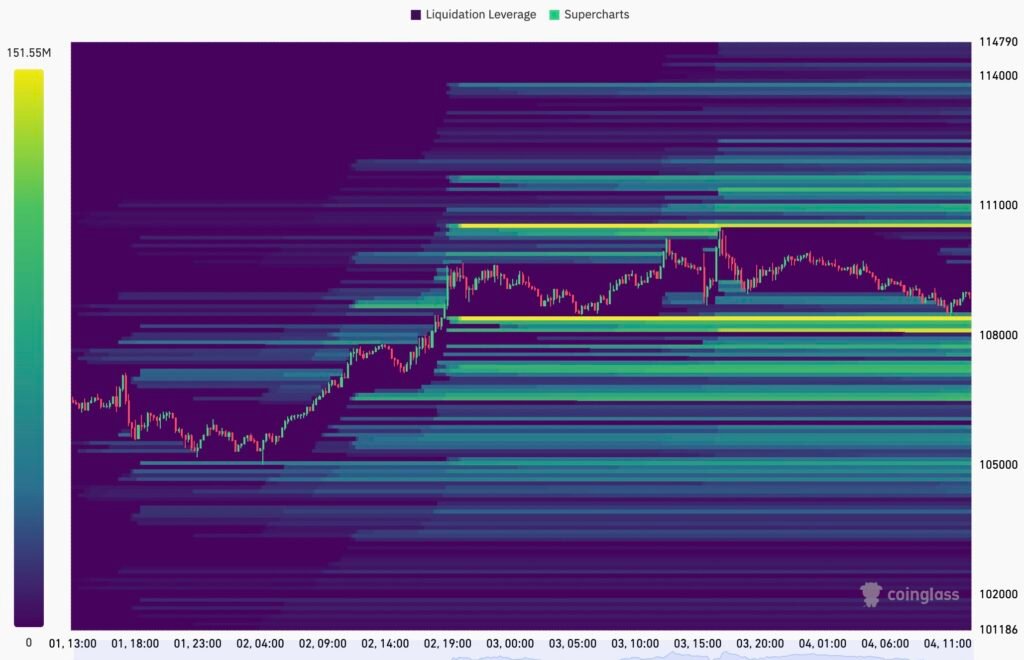
A break above could force short sellers to close positions rapidly, pushing the price toward $114,000. On the flip side, substantial bid orders are clustered around $108,000, with more support seen between $107,700 and $105,000.
For now, Bitcoin remains stuck in a tight range, and traders are closely watching for either a confirmed breakout or a breakdown. With technical and historical signals flashing red, bulls have little room for error.